The UK topsoil geochemistry dataset combines data from five different topsoil survey projects spanning from 1978 to 2014: the G-BASE Regional, TellusNI Regional, G-BASE Urban, TellusNI Urban topsoil (5 to 20 cm) surveys, and the Rothamsted Research-BGS x-ray fluorescence spectrometry (RR-BGS XRF) dataset, which was a joint project between British Geological Survey (BGS) and Rothamsted Research to analyse the samples from the National Soils Inventory (NSI) 0 to 15 cm topsoil survey by XRF.
Together, these 5 survey datasets comprise analyses of a total of 57966 topsoil samples covering Northern Ireland, England, Wales and the basin of the River Clyde in Scotland. Differences in the strategy, sampling density, soil sampling and sample preparation procedures employed by each survey are reported in the Rural and Urban Topsoil geochemical atlas for England, Wales, Northern Ireland and part of Scotland (Everett et. al. 2023); the words 'Regional' and 'Rural' are synonyms in the context of the present work.
All samples were analysed by XRF to determine the total concentration of the 41 elements shown. For each element, the difference between the mean concentration measured by repeated analyses of four Certified Reference Materials (CRMs) and the accepted concentrations of that element in the CRMs provides a measure of the measurement accuracy. More importantly, the respective correlation coefficient equation was used to calibrate the element concentrations across the 5 surveys in a data levelling process (Lister and Johnson, 2005 (pdf)).
To convert the point source data to a continuous surface, a prediction map was produced for each element using the ordinary kriging method within ESRI® ArcGIS Geostatistical Analyst. The data was log-transformed (except for the normally distributed Al2O3, K2O, SiO2, Ga, Nd, Rb and Sc) as this helped to adjust the highly skewed data to better approximate a normal distribution. The ordinary kriging method fitted an exponential variogram, which generally was fitted to exclude the nugget, and applied this to interpolate of the element concentration data across the target area using the nearest 5 to 8 neighbours within a maximum search radius of 10km. The interpolated data was used to generate a prediction map and a prediction standard error map for each element. These maps are available for download as GeoTIFF raster images with a cell size of 500 x 500 m, and the prediction map is also available as a high resolution colour raw map image in PNG format to access in UKSO.
Additionally, map images that include an informative header and footer, are overlain with geological linework, British National Grid gridlines, boundary lines, and delineated urban survey areas are available for download in PNG format. For the 10 major elements (Al2O3, CaO, Fe2O3, K2O, MgO, MnO, Na2O, P2O5, SiO2, TiO2) concentrations are presented as a weight percent of their respective oxide (wt%) and for the remaining 31 elements (As, Ba, Br, Cd, Ce, Co, Cr, Cs, Cu, Ga, Hf, I, La, Mo, Nb, Nd, Ni, Pb, Rb, Sb, Sc, Se, Sn, Sr, Th, U, V, W, Y, Zn and Zr) concentrations are presented in mg/kg.
The map outputs from the UK topsoil geochemistry Dataset are assembled and made available as the UK topsoil geochemistry GeoTIFF raster dataset (UKTSraster), which includes a User Guide providing information about the production of the maps. Everett et al. (2023) provides more information about the history of the G-BASE, TellusNI and RR-BGS XRF projects, and further detail about the sampling, sample preparation, analysis and data quality control methods.
These data are delivered under the terms of the Open Government Licence, subject to the following acknowledgement accompanying the reproduced BGS/GSNI materials: "Contains British Geological Survey and Geological Survey of Northern Ireland materials © NERC, UKRI [2023]; British Geological Survey-Rothamsted Research XRF Dataset, based on sub-samples at Rothamsted Research from the National Soil Inventory of England and Wales sample archive, National Soil Resources Institute, Cranfield University".
Aluminium concentrations (presented as Al2O3 and with units in w%), were determined by XRF with a lower limit of detection of 0.05 wt% Al2O3. Approximately 95% of the total variability within the Al2O3 data can be attributed to natural geochemical differences between sites, meaning that the variability due to sampling, sample preparation and analytical procedures is approximately 5 %; this was estimated using a nested analysis of variance (ANOVA) procedure based on 445 sets of field duplicate and lab replicate samples. Measurement precision, which was estimated from the coefficients of variation (CV) of repeated analyses of certified reference materials (CRMs), is approximately 5%.
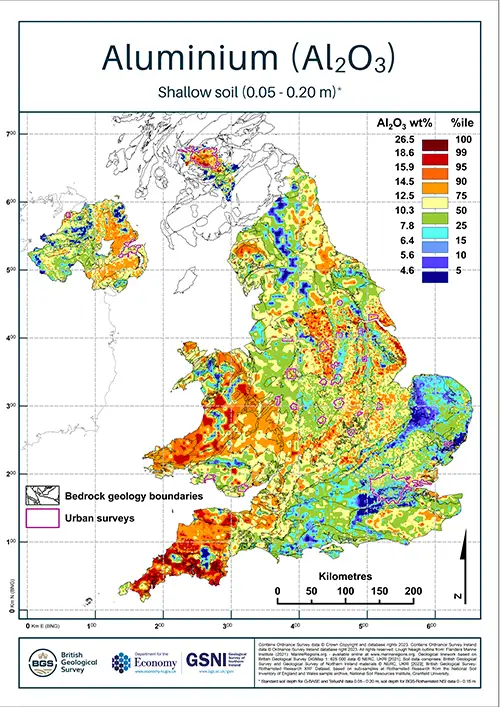
| Title | Compiled topsoil aluminium (Al2O3) concentrations |
|---|---|
| Source | British Geological Survey |
| Enquiries | enquiries@bgs.ac.uk |
| Scale(s) | 500m grid resolution |
| Coverage | England, Wales, Northern Ireland and Clyde Basin |
| Formats and download |
Download GeoTIFF (zip) Download .png files with and without urban survey outlines (zip) |
| Price | Free for use under Open Government Licence terms |
| Uses | Local to national level use |
| Map portal | Access in UKSO Map portal |
| WMS | WMS feed |
Antimony concentrations (presented as Sb and with units in mg/kg), were determined by XRF with a lower limit of detection of 0.25 mg/kg Sb. Approximately 81% of the total variability within the Sb data can be attributed to natural geochemical differences between sites, meaning that the variability due to sampling, sample preparation and analytical procedures is approximately 19%; this was estimated using a nested analysis of variance (ANOVA) procedure based on 386 sets of field duplicate and lab replicate samples. Measurement precision, which was estimated from the coefficients of variation (CV) of repeated analyses of certified reference materials (CRMs), is approximately 19%.
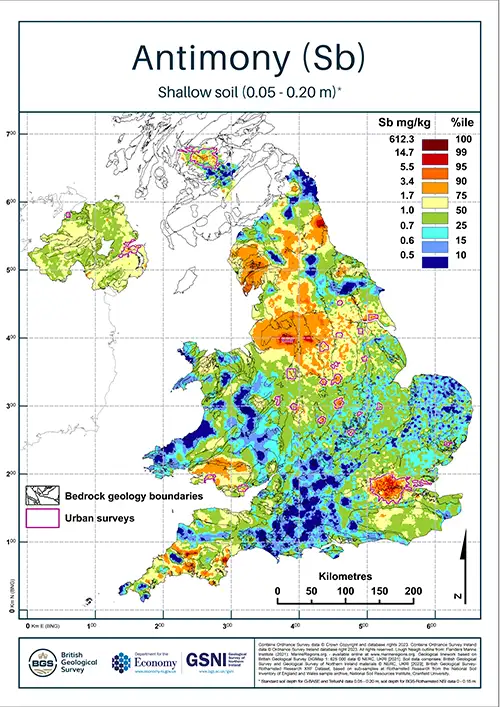
| Title | Compiled topsoil antimony (Sb) concentrations |
|---|---|
| Source | British Geological Survey |
| Enquiries | enquiries@bgs.ac.uk |
| Scale(s) | 500m grid resolution |
| Coverage | England, Wales, Northern Ireland and Clyde Basin |
| Formats and download |
Download GeoTIFF (zip) Download .png files with and without urban survey outlines (zip) |
| Price | Free for use under Open Government Licence terms |
| Uses | Local to national level use |
| Map portal | Access in UKSO Map portal |
| WMS | WMS feed |
Arsenic concentrations (presented as As and with units in mg/kg), were determined by XRF with a lower limit of detection of 0.9 mg/kg As. Approximately 92% of the total variability within the As data can be attributed to natural geochemical differences between sites, meaning that the variability due to sampling, sample preparation and analytical procedures is approximately 8%; this was estimated using a nested analysis of variance (ANOVA) procedure based on 450 sets of field duplicate and lab replicate samples. Measurement precision, which was estimated from the coefficients of variation (CV) of repeated analyses of certified reference materials (CRMs), is approximately 2%.
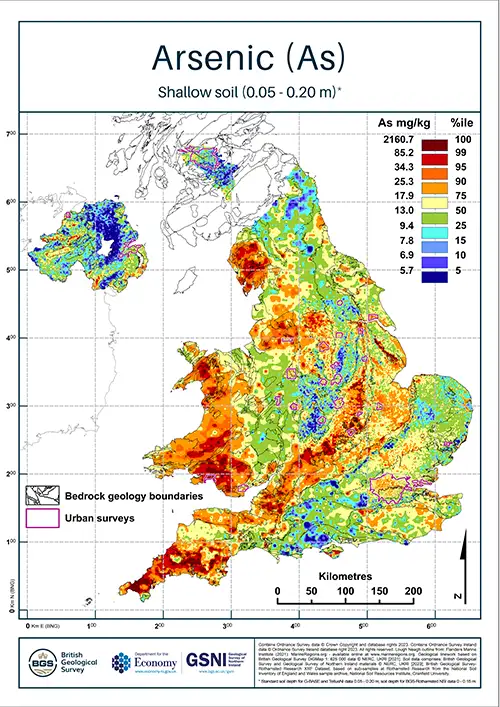
| Title | Compiled topsoil arsenic (As) concentrations |
|---|---|
| Source | British Geological Survey |
| Enquiries | enquiries@bgs.ac.uk |
| Scale(s) | 500m grid resolution |
| Coverage | England, Wales, Northern Ireland and Clyde Basin |
| Formats and download |
Download GeoTIFF (zip) Download .png files with and without urban survey outlines (zip) |
| Price | Free for use under Open Government Licence terms |
| Uses | Local to national level use |
| Map portal | Access in UKSO Map portal |
| WMS | WMS feed |
Barium concentrations (presented as Ba and with units in mg/kg), were determined by XRF with a lower limit of detection of 0.5 mg/kg Ba. Approximately 93% of the total variability within the Ba data can be attributed to natural geochemical differences between sites, meaning that the variability due to sampling, sample preparation and analytical procedures is approximately 7%; this was estimated using a nested analysis of variance (ANOVA) procedure based on 450 sets of field duplicate and lab replicate samples. Measurement precision, which was estimated from the coefficients of variation (CV) of repeated analyses of certified reference materials (CRMs), is approximately 2%.
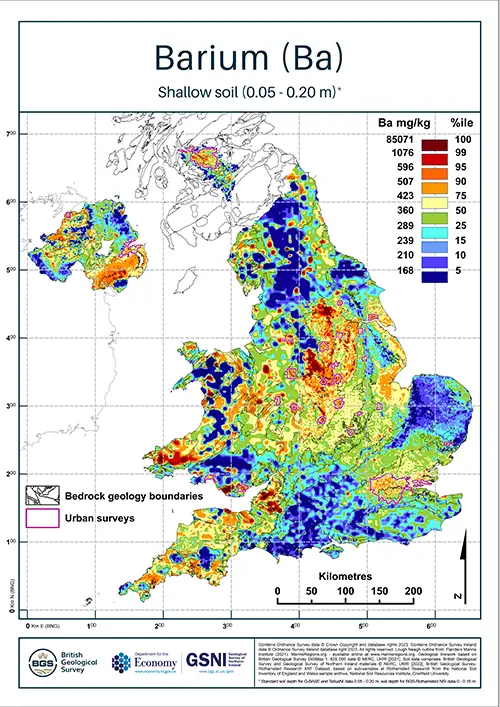
| Title | Compiled topsoil barium (Ba) concentrations |
|---|---|
| Source | British Geological Survey |
| Enquiries | enquiries@bgs.ac.uk |
| Scale(s) | 500m grid resolution |
| Coverage | England, Wales, Northern Ireland and Clyde Basin |
| Formats and download |
Download GeoTIFF (zip) Download .png files with and without urban survey outlines (zip) |
| Price | Free for use under Open Government Licence terms |
| Uses | Local to national level use |
| Map portal | Access in UKSO Map portal |
| WMS | WMS feed |
Bromine concentrations (presented as Br and with units in mg/kg), were determined by XRF with a lower limit of detection of 0.7 mg/kg Br. Approximately 93% of the total variability within the Br data can be attributed to natural geochemical differences between sites, meaning that the variability due to sampling, sample preparation and analytical procedures is approximately 7%; this was estimated using a nested analysis of variance (ANOVA) procedure based on 387 sets of field duplicate and lab replicate samples. Measurement precision, which was estimated from the coefficients of variation (CV) of repeated analyses of certified reference materials (CRMs), is approximately 8%.
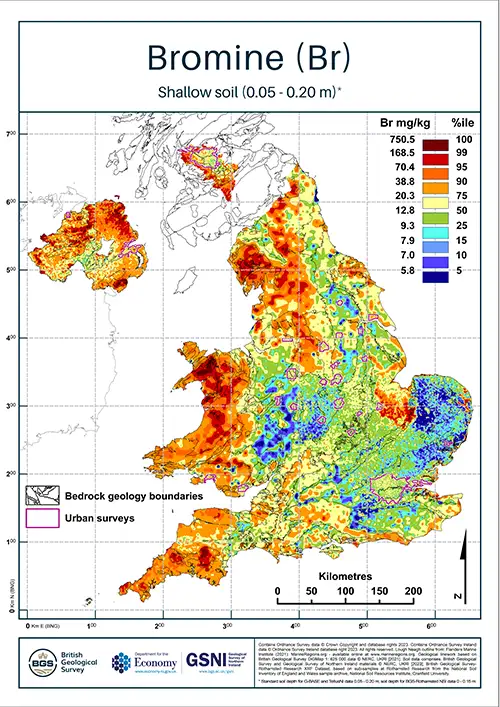
| Title | Compiled topsoil bromine (Br) concentrations |
|---|---|
| Source | British Geological Survey |
| Enquiries | enquiries@bgs.ac.uk |
| Scale(s) | 500m grid resolution |
| Coverage | England, Wales, Northern Ireland and Clyde Basin |
| Formats and download |
Download GeoTIFF (zip) Download .png files with and without urban survey outlines (zip) |
| Price | Free for use under Open Government Licence terms |
| Uses | Local to national level use |
| Map portal | Access in UKSO Map portal |
| WMS | WMS feed |
Cadmium concentrations (presented as Cd and with units in mg/kg), were determined by XRF with a lower limit of detection of 0.25 mg/kg Cd. Approximately 70% of the total variability within the Cd data can be attributed to natural geochemical differences between sites, meaning that the variability due to sampling, sample preparation and analytical procedures is approximately 30%; this was estimated using a nested analysis of variance (ANOVA) procedure based on 205 sets of field duplicate and lab replicate samples. Measurement precision, which was estimated from the coefficients of variation (CV) of repeated analyses of certified reference materials (CRMs), is approximately 11%.
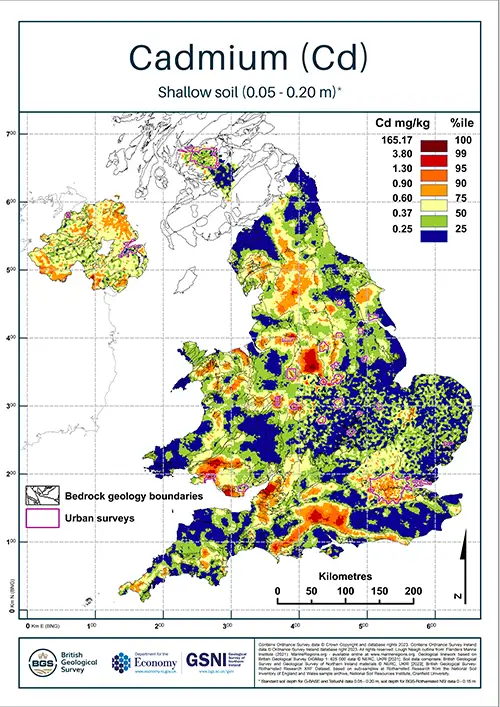
| Title | Compiled topsoil cadmium (Cd) concentrations |
|---|---|
| Source | British Geological Survey |
| Enquiries | enquiries@bgs.ac.uk |
| Scale(s) | 500m grid resolution |
| Coverage | England, Wales, Northern Ireland and Clyde Basin |
| Formats and download |
Download GeoTIFF (zip) Download .png files with and without urban survey outlines (zip) |
| Price | Free for use under Open Government Licence terms |
| Uses | Local to national level use |
| Map portal | Access in UKSO Map portal |
| WMS | WMS feed |
Caesium concentrations (presented as Cs and with units in mg/kg), were determined by XRF with a lower limit of detection of 0.5 mg/kg Cs. Approximately 81% of the total variability within the Cs data can be attributed to natural geochemical differences between sites, meaning that the variability due to sampling, sample preparation and analytical procedures is approximately 19%; this was estimated using a nested analysis of variance (ANOVA) procedure based on 374 sets of field duplicate and lab replicate samples. Measurement precision, which was estimated from the coefficients of variation (CV) of repeated analyses of certified reference materials (CRMs), is approximately 22%.
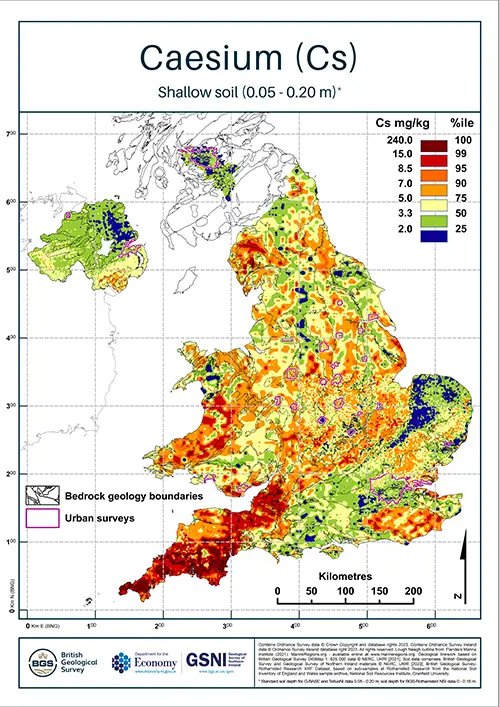
| Title | Compiled topsoil caesium (Cs) concentrations |
|---|---|
| Source | British Geological Survey |
| Enquiries | enquiries@bgs.ac.uk |
| Scale(s) | 500m grid resolution |
| Coverage | England, Wales, Northern Ireland and Clyde Basin |
| Formats and download |
Download GeoTIFF (zip) Download .png files with and without urban survey outlines (zip) |
| Price | Free for use under Open Government Licence terms |
| Uses | Local to national level use |
| Map portal | Access in UKSO Map portal |
| WMS | WMS feed |
Calcium concentrations (presented as CaO and with units in w%), were determined by XRF with a lower limit of detection of 0.025 wt% CaO. Approximately 93% of the total variability within the CaO data can be attributed to natural geochemical differences between sites, meaning that the variability due to sampling, sample preparation and analytical procedures is approximately 7%; this was estimated using a nested analysis of variance (ANOVA) procedure based on 450 sets of field duplicate and lab replicate samples. Measurement precision, which was estimated from the coefficients of variation (CV) of repeated analyses of certified reference materials (CRMs), is approximately 3%.
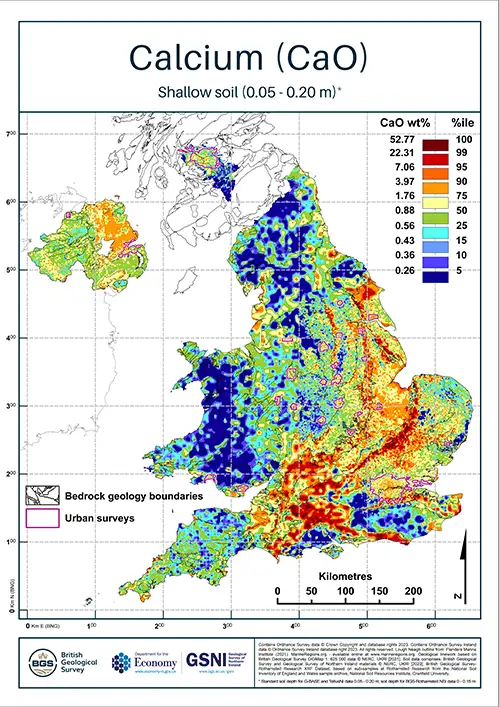
| Title | Compiled topsoil calcium (CaO) concentrations |
|---|---|
| Source | British Geological Survey |
| Enquiries | enquiries@bgs.ac.uk |
| Scale(s) | 500m grid resolution |
| Coverage | England, Wales, Northern Ireland and Clyde Basin |
| Formats and download |
Download GeoTIFF (zip) Download .png files with and without urban survey outlines (zip) |
| Price | Free for use under Open Government Licence terms |
| Uses | Local to national level use |
| Map portal | Access in UKSO Map portal |
| WMS | WMS feed |
Cerium concentrations (presented as Ce and with units in mg/kg), were determined by XRF with a lower limit of detection of 0.6 mg/kg Ce. Approximately 94% of the total variability within the Ce data can be attributed to natural geochemical differences between sites, meaning that the variability due to sampling, sample preparation and analytical procedures is approximately 6%; this was estimated using a nested analysis of variance (ANOVA) procedure based on 437 sets of field duplicate and lab replicate samples. Measurement precision, which was estimated from the coefficients of variation (CV) of repeated analyses of certified reference materials (CRMs), is approximately 6%.
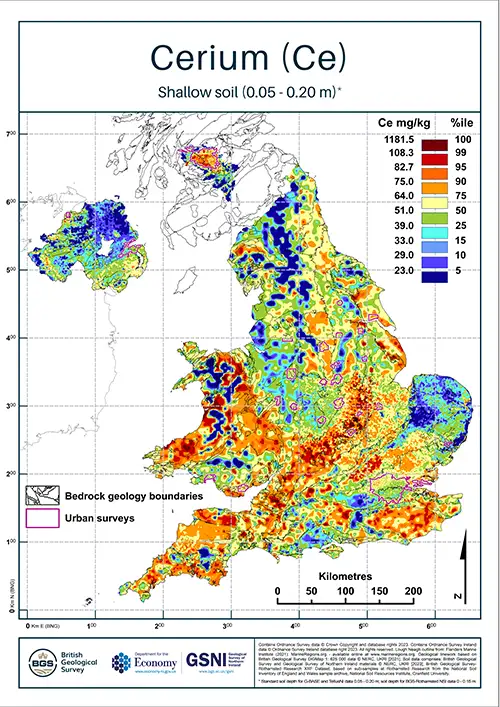
| Title | Compiled topsoil cerium (Ce) concentrations |
|---|---|
| Source | British Geological Survey |
| Enquiries | enquiries@bgs.ac.uk |
| Scale(s) | 500m grid resolution |
| Coverage | England, Wales, Northern Ireland and Clyde Basin |
| Formats and download |
Download GeoTIFF (zip) Download .png files with and without urban survey outlines (zip) |
| Price | Free for use under Open Government Licence terms |
| Uses | Local to national level use |
| Map portal | Access in UKSO Map portal |
| WMS | WMS feed |
Chromium concentrations (presented as Cr and with units in mg/kg), were determined by XRF with a lower limit of detection of 2.8 mg/kg Cr. Approximately 90% of the total variability within the Cr data can be attributed to natural geochemical differences between sites, meaning that the variability due to sampling, sample preparation and analytical procedures is approximately 10%; this was estimated using a nested analysis of variance (ANOVA) procedure based on 450 sets of field duplicate and lab replicate samples. Measurement precision, which was estimated from the coefficients of variation (CV) of repeated analyses of certified reference materials (CRMs), is approximately 7%.
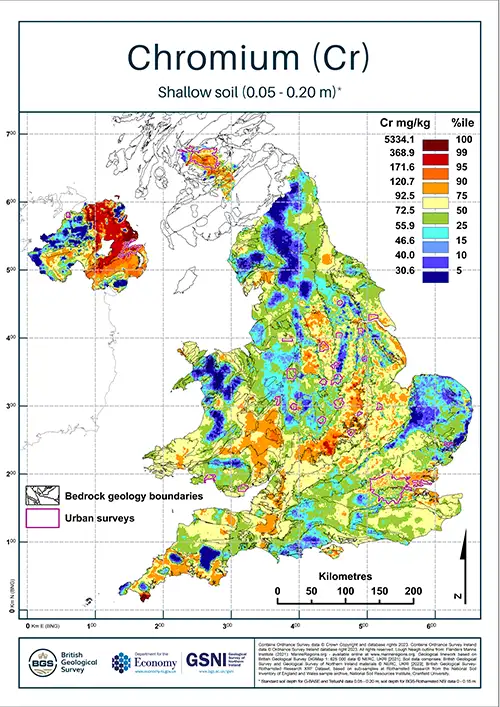
| Title | Compiled topsoil chromium (Cr) concentrations |
|---|---|
| Source | British Geological Survey |
| Enquiries | enquiries@bgs.ac.uk |
| Scale(s) | 500m grid resolution |
| Coverage | England, Wales, Northern Ireland and Clyde Basin |
| Formats and download |
Download GeoTIFF (zip) Download .png files with and without urban survey outlines (zip) |
| Price | Free for use under Open Government Licence terms |
| Uses | Local to national level use |
| Map portal | Access in UKSO Map portal |
| WMS | WMS feed |
Cobalt concentrations (presented as Co and with units in mg/kg), were determined by XRF with a lower limit of detection of 1.5 mg/kg Co. Approximately 90% of the total variability within the Co data can be attributed to natural geochemical differences between sites, meaning that the variability due to sampling, sample preparation and analytical procedures is approximately 10%; this was estimated using a nested analysis of variance (ANOVA) procedure based on 450 sets of field duplicate and lab replicate samples. Measurement precision, which was estimated from the coefficients of variation (CV) of repeated analyses of certified reference materials (CRMs), is approximately 6%.
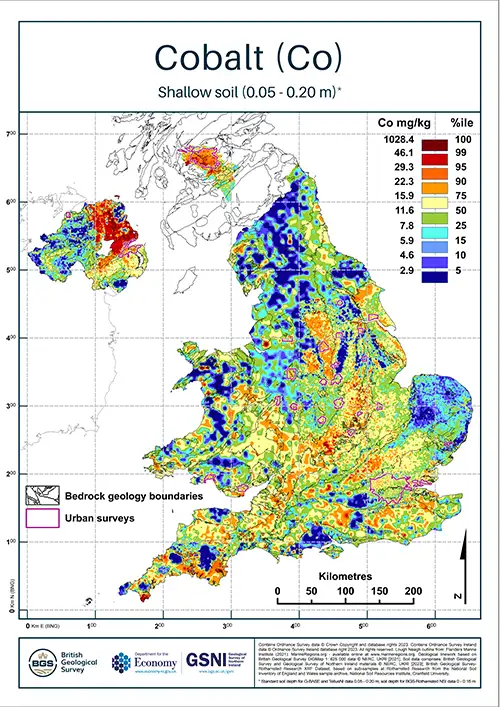
| Title | Compiled topsoil cobalt (Co) concentrations |
|---|---|
| Source | British Geological Survey |
| Enquiries | enquiries@bgs.ac.uk |
| Scale(s) | 500m grid resolution |
| Coverage | England, Wales, Northern Ireland and Clyde Basin |
| Formats and download |
Download GeoTIFF (zip) Download .png files with and without urban survey outlines (zip) |
| Price | Free for use under Open Government Licence terms |
| Uses | Local to national level use |
| Map portal | Access in UKSO Map portal |
| WMS | WMS feed |
Copper concentrations (presented as Cu and with units in mg/kg), were determined by XRF with a lower limit of detection of 1.2 mg/kg Cu. Approximately 88% of the total variability within the Cu data can be attributed to natural geochemical differences between sites, meaning that the variability due to sampling, sample preparation and analytical procedures is approximately 12%; this was estimated using a nested analysis of variance (ANOVA) procedure based on 450 sets of field duplicate and lab replicate samples. Measurement precision, which was estimated from the coefficients of variation (CV) of repeated analyses of certified reference materials (CRMs), is approximately 3%.
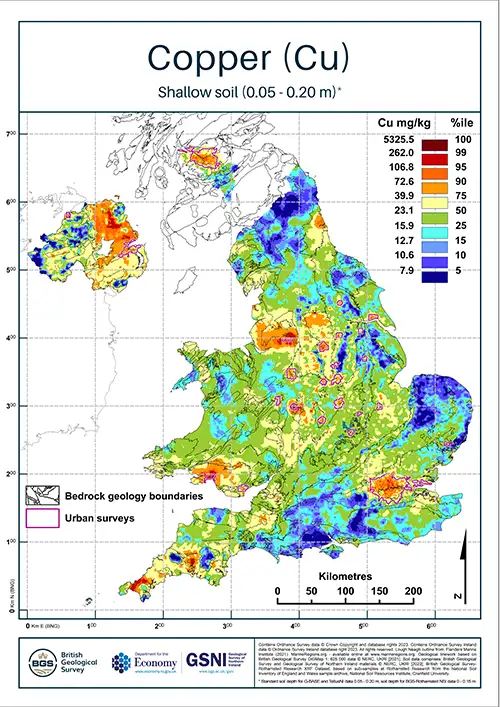
| Title | Compiled topsoil copper (Cu) concentrations |
|---|---|
| Source | British Geological Survey |
| Enquiries | enquiries@bgs.ac.uk |
| Scale(s) | 500m grid resolution |
| Coverage | England, Wales, Northern Ireland and Clyde Basin |
| Formats and download |
Download GeoTIFF (zip) Download .png files with and without urban survey outlines (zip) |
| Price | Free for use under Open Government Licence terms |
| Uses | Local to national level use |
| Map portal | Access in UKSO Map portal |
| WMS | WMS feed |
Gallium concentrations (presented as Ga and with units in mg/kg), were determined by XRF with a lower limit of detection of 1.0 mg/kg Ga. Approximately 93% of the total variability within the Ga data can be attributed to natural geochemical differences between sites, meaning that the variability due to sampling, sample preparation and analytical procedures is approximately 7%; this was estimated using a nested analysis of variance (ANOVA) procedure based on 387 sets of field duplicate and lab replicate samples. Measurement precision, which was estimated from the coefficients of variation (CV) of repeated analyses of certified reference materials (CRMs), is approximately 5%.
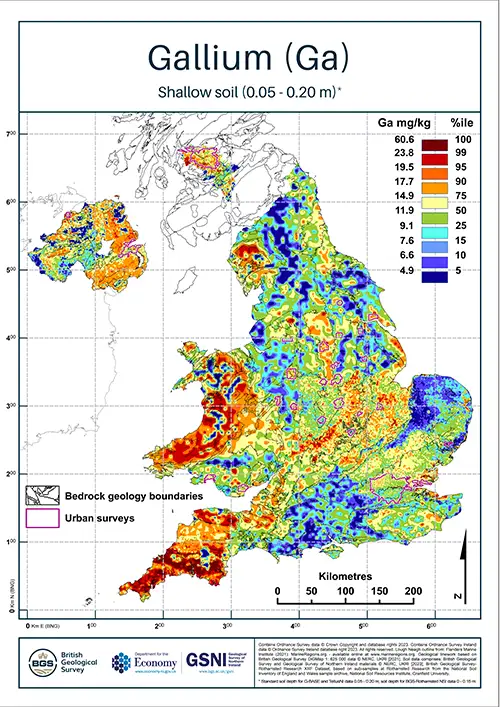
| Title | Compiled topsoil gallium (Ga) concentrations |
|---|---|
| Source | British Geological Survey |
| Enquiries | enquiries@bgs.ac.uk |
| Scale(s) | 500m grid resolution |
| Coverage | England, Wales, Northern Ireland and Clyde Basin |
| Formats and download |
Download GeoTIFF (zip) Download .png files with and without urban survey outlines (zip) |
| Price | Free for use under Open Government Licence terms |
| Uses | Local to national level use |
| Map portal | Access in UKSO Map portal |
| WMS | WMS feed |
Hafnium concentrations (presented as Hf and with units in mg/kg), were determined by XRF with a lower limit of detection of 1.0 mg/kg Hf. Approximately 87% of the total variability within the Ga data can be attributed to natural geochemical differences between sites, meaning that the variability due to sampling, sample preparation and analytical procedures is approximately 13%; this was estimated using a nested analysis of variance (ANOVA) procedure based on 387 sets of field duplicate and lab replicate samples. Measurement precision, which was estimated from the coefficients of variation (CV) of repeated analyses of certified reference materials (CRMs), is approximately 18%.
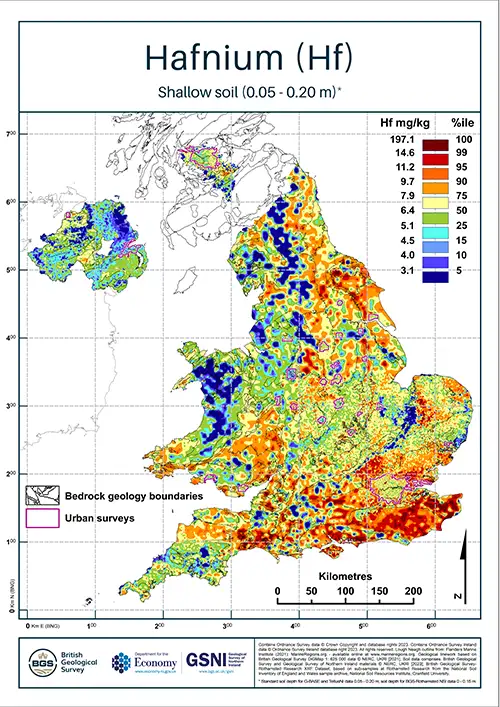
| Title | Compiled topsoil hafnium (Hf) concentrations |
|---|---|
| Source | British Geological Survey |
| Enquiries | enquiries@bgs.ac.uk |
| Scale(s) | 500m grid resolution |
| Coverage | England, Wales, Northern Ireland and Clyde Basin |
| Formats and download |
Download GeoTIFF (zip) Download .png files with and without urban survey outlines (zip) |
| Price | Free for use under Open Government Licence terms |
| Uses | Local to national level use |
| Map portal | Access in UKSO Map portal |
| WMS | WMS feed |
Iodine concentrations (presented as I and with units in mg/kg), were determined by XRF with a lower limit of detection of 0.35 mg/kg I. Approximately 90% of the total variability within the I data can be attributed to natural geochemical differences between sites, meaning that the variability due to sampling, sample preparation and analytical procedures is approximately 10%; this was estimated using a nested analysis of variance (ANOVA) procedure based on 374 sets of field duplicate and lab replicate samples. Measurement precision, which was estimated from the coefficients of variation (CV) of repeated analyses of certified reference materials (CRMs), is approximately 11%.
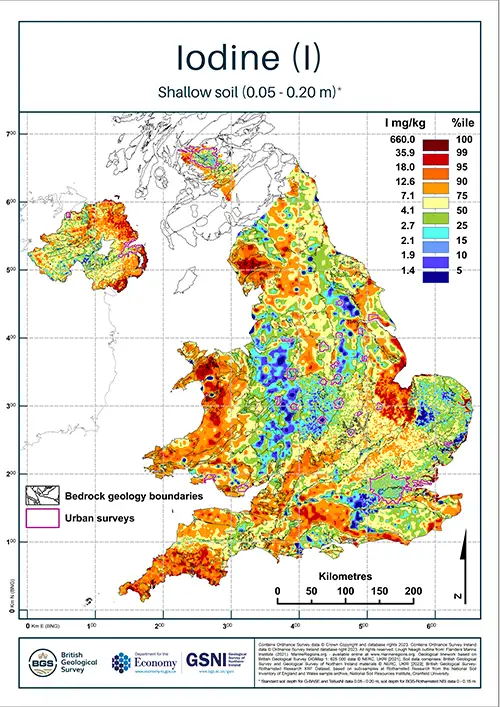
| Title | Compiled topsoil iodine (I) concentrations |
|---|---|
| Source | British Geological Survey |
| Enquiries | enquiries@bgs.ac.uk |
| Scale(s) | 500m grid resolution |
| Coverage | England, Wales, Northern Ireland and Clyde Basin |
| Formats and download |
Download GeoTIFF (zip) Download .png files with and without urban survey outlines (zip) |
| Price | Free for use under Open Government Licence terms |
| Uses | Local to national level use |
| Map portal | Access in UKSO Map portal |
| WMS | WMS feed |
Iron concentrations (presented as Fe2O3 and with units in w%), were determined by XRF with a lower limit of detection of 0.005 wt% Fe2O3. Approximately 94% of the total variability within the Fe2O3 data can be attributed to natural geochemical differences between sites, meaning that the variability due to sampling, sample preparation and analytical procedures is approximately. 6%; this was estimated using a nested analysis of variance (ANOVA) procedure based on 450 sets of field duplicate and lab replicate samples. Measurement precision, which was estimated from the coefficients of variation (CV) of repeated analyses of certified reference materials (CRMs), is approximately 2%.
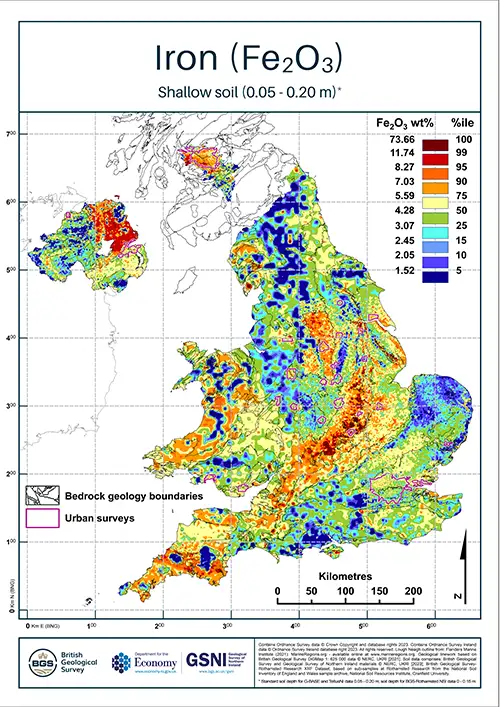
| Title | Compiled topsoil iron (Fe2O3) concentrations |
|---|---|
| Source | British Geological Survey |
| Enquiries | enquiries@bgs.ac.uk |
| Scale(s) | 500m grid resolution |
| Coverage | England, Wales, Northern Ireland and Clyde Basin |
| Formats and download |
Download GeoTIFF (zip) Download .png files with and without urban survey outlines (zip) |
| Price | Free for use under Open Government Licence terms |
| Uses | Local to national level use |
| Map portal | Access in UKSO Map portal |
| WMS | WMS feed |
Lanthanum concentrations (presented as La and with units in mg/kg), were determined by XRF with a lower limit of detection of 0.6 mg/kg La. Approximately 94% of the total variability within the La data can be attributed to natural geochemical differences between sites, meaning that the variability due to sampling, sample preparation and analytical procedures is approximately 6%; this was estimated using a nested analysis of variance (ANOVA) procedure based on 371 sets of field duplicate and lab replicate samples. Measurement precision, which was estimated from the coefficients of variation (CV) of repeated analyses of certified reference materials (CRMs), is approximately 5%.
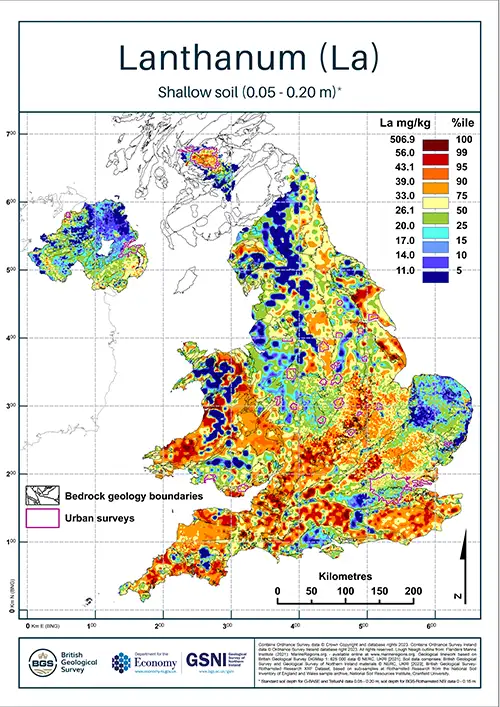
| Title | Compiled topsoil lanthanum (La) concentrations |
|---|---|
| Source | British Geological Survey |
| Enquiries | enquiries@bgs.ac.uk |
| Scale(s) | 500m grid resolution |
| Coverage | England, Wales, Northern Ireland and Clyde Basin |
| Formats and download |
Download GeoTIFF (zip) Download .png files with and without urban survey outlines (zip) |
| Price | Free for use under Open Government Licence terms |
| Uses | Local to national level use |
| Map portal | Access in UKSO Map portal |
| WMS | WMS feed |
Lead concentrations (presented as Pb and with units in mg/kg), were determined by XRF with a lower limit of detection of 1.2 mg/kg Pb. Approximately 90% of the total variability within the Pb data can be attributed to natural geochemical differences between sites, meaning that the variability due to sampling, sample preparation and analytical procedures is approximately 10%; this was estimated using a nested analysis of variance (ANOVA) procedure based on 450 sets of field duplicate and lab replicate samples. Measurement precision, which was estimated from the coefficients of variation (CV) of repeated analyses of certified reference materials (CRMs), is approximately 2%.
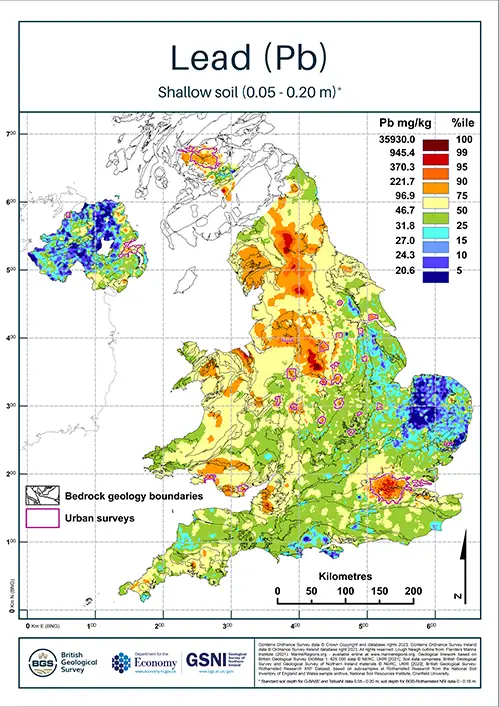
| Title | Compiled topsoil lead (Pb) concentrations |
|---|---|
| Source | British Geological Survey |
| Enquiries | enquiries@bgs.ac.uk |
| Scale(s) | 500m grid resolution |
| Coverage | England, Wales, Northern Ireland and Clyde Basin |
| Formats and download |
Download GeoTIFF (zip) Download .png files with and without urban survey outlines (zip) |
| Price | Free for use under Open Government Licence terms |
| Uses | Local to national level use |
| Map portal | Access in UKSO Map portal |
| WMS | WMS feed |
Magnesium concentrations (presented as MgO and with units in w%), were determined by XRF with a lower limit of detection of 0.1 wt% MgO. Approximately 95% of the total variability within the MgO data can be attributed to natural geochemical differences between sites, meaning that the variability due to sampling, sample preparation and analytical procedures is approximately 5%; this was estimated using a nested analysis of variance (ANOVA) procedure based on 428 sets of field duplicate and lab replicate samples. Measurement precision, which was estimated from the coefficients of variation (CV) of repeated analyses of certified reference materials (CRMs), is approximately 5%.
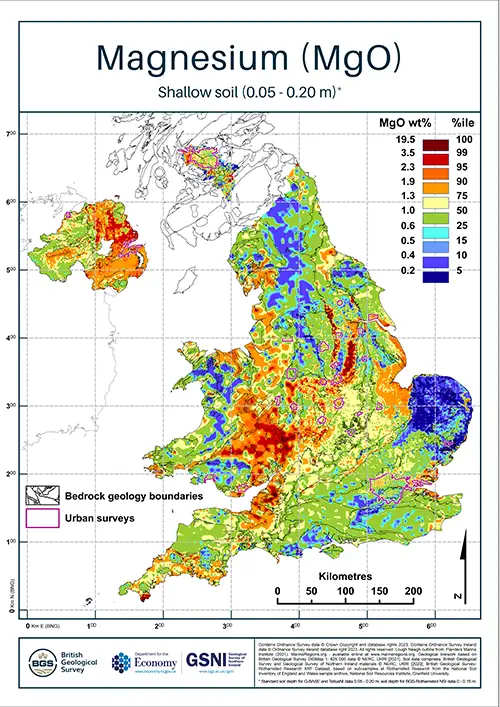
| Title | Compiled topsoil magnesium (MgO) concentrations |
|---|---|
| Source | British Geological Survey |
| Enquiries | enquiries@bgs.ac.uk |
| Scale(s) | 500m grid resolution |
| Coverage | England, Wales, Northern Ireland and Clyde Basin |
| Formats and download |
Download GeoTIFF (zip) Download .png files with and without urban survey outlines (zip) |
| Price | Free for use under Open Government Licence terms |
| Uses | Local to national level use |
| Map portal | Access in UKSO Map portal |
| WMS | WMS feed |
Manganese concentrations (presented as MnO and with units in w%), were determined by XRF with a lower limit of detection of 0.005 wt% MnO. Approximately 92% of the total variability within the MnO data can be attributed to natural geochemical differences between sites, meaning that the variability due to sampling, sample preparation and analytical procedures is approximately 8%; this was estimated using a nested analysis of variance (ANOVA) procedure based on 450 sets of field duplicate and lab replicate samples. Measurement precision, which was estimated from the coefficients of variation (CV) of repeated analyses of certified reference materials (CRMs), is approximately 3%.
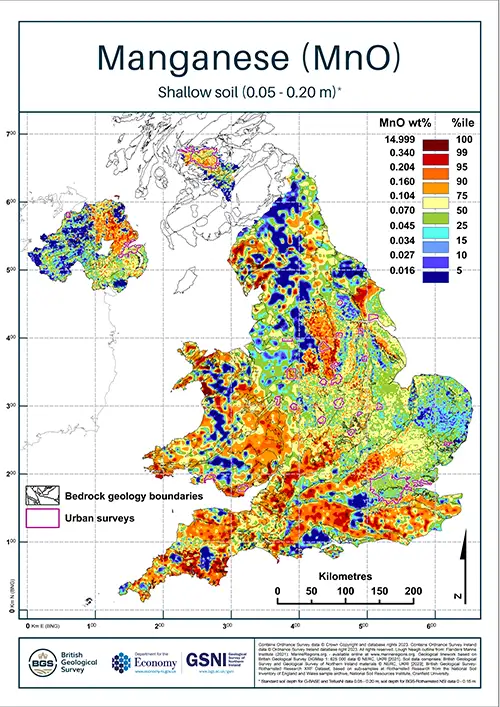
| Title | Compiled topsoil manganese (MnO) concentrations |
|---|---|
| Source | British Geological Survey |
| Enquiries | enquiries@bgs.ac.uk |
| Scale(s) | 500m grid resolution |
| Coverage | England, Wales, Northern Ireland and Clyde Basin |
| Formats and download |
Download GeoTIFF (zip) Download .png files with and without urban survey outlines (zip) |
| Price | Free for use under Open Government Licence terms |
| Uses | Local to national level use |
| Map portal | Access in UKSO Map portal |
| WMS | WMS feed |
Molybdenum concentrations (presented as Mo and with units in mg/kg), were determined by XRF with a lower limit of detection of 0.2 mg/kg Mo. Approximately 86% of the total variability within the Mo data can be attributed to natural geochemical differences between sites, meaning that the variability due to sampling, sample preparation and analytical procedures is approximately 14%; this was estimated using a nested analysis of variance (ANOVA) procedure based on 366 sets of field duplicate and lab replicate samples. Measurement precision, which was estimated from the coefficients of variation (CV) of repeated analyses of certified reference materials (CRMs), is approximately 20%.
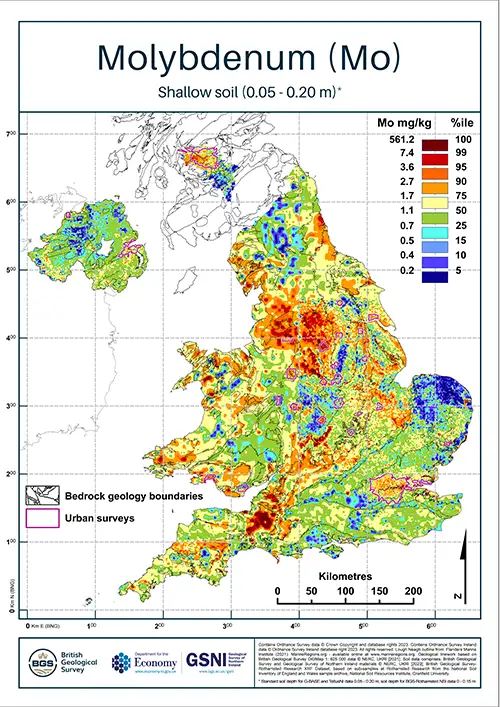
| Title | Compiled topsoil molybdenum (Mo) concentrations |
|---|---|
| Source | British Geological Survey |
| Enquiries | enquiries@bgs.ac.uk |
| Scale(s) | 500m grid resolution |
| Coverage | England, Wales, Northern Ireland and Clyde Basin |
| Formats and download |
Download GeoTIFF (zip) Download .png files with and without urban survey outlines (zip) |
| Price | Free for use under Open Government Licence terms |
| Uses | Local to national level use |
| Map portal | Access in UKSO Map portal |
| WMS | WMS feed |
Neodymium concentrations (presented as Nd and with units in mg/kg), were determined by XRF with a lower limit of detection of 4 mg/kg Nd. Approximately 91% of the total variability within the Nd data can be attributed to natural geochemical differences between sites, meaning that the variability due to sampling, sample preparation and analytical procedures is approximately 9%; this was estimated using a nested analysis of variance (ANOVA) procedure based on 269 sets of field duplicate and lab replicate samples. Measurement precision, which was estimated from the coefficients of variation (CV) of repeated analyses of certified reference materials (CRMs), is approximately 7%.
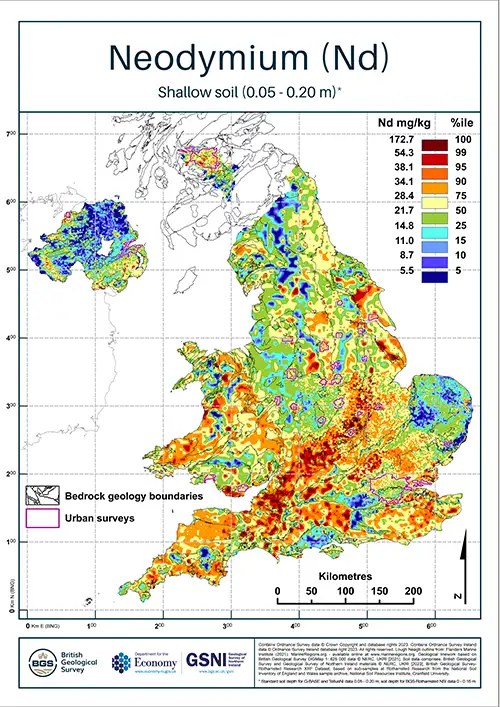
| Title | Compiled topsoil neodymium (Nd) concentrations |
|---|---|
| Source | British Geological Survey |
| Enquiries | enquiries@bgs.ac.uk |
| Scale(s) | 500m grid resolution |
| Coverage | England, Wales, Northern Ireland and Clyde Basin |
| Formats and download |
Download GeoTIFF (zip) Download .png files with and without urban survey outlines (zip) |
| Price | Free for use under Open Government Licence terms |
| Uses | Local to national level use |
| Map portal | Access in UKSO Map portal |
| WMS | WMS feed |
Nickel concentrations (presented as Ni and with units in mg/kg), were determined by XRF with a lower limit of detection of 1.3 mg/kg Ni. Approximately 92% of the total variability within the Ni data can be attributed to natural geochemical differences between sites, meaning that the variability due to sampling, sample preparation and analytical procedures is approximately 8%; this was estimated using a nested analysis of variance (ANOVA) procedure based on 450 sets of field duplicate and lab replicate samples. Measurement precision, which was estimated from the coefficients of variation (CV) of repeated analyses of certified reference materials (CRMs), is approximately 3%.
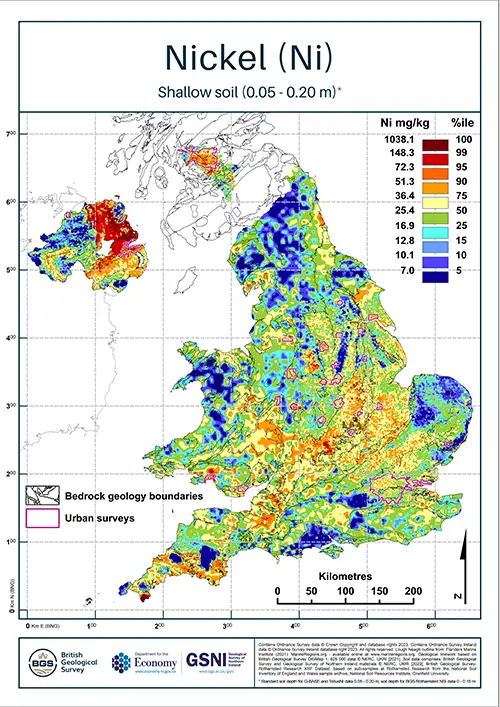
| Title | Compiled topsoil nickel (Ni) concentrations |
|---|---|
| Source | British Geological Survey |
| Enquiries | enquiries@bgs.ac.uk |
| Scale(s) | 500m grid resolution |
| Coverage | England, Wales, Northern Ireland and Clyde Basin |
| Formats and download |
Download GeoTIFF (zip) Download .png files with and without urban survey outlines (zip) |
| Price | Free for use under Open Government Licence terms |
| Uses | Local to national level use |
| Map portal | Access in UKSO Map portal |
| WMS | WMS feed |
Niobium concentrations (presented as Nb and with units in mg/kg), were determined by XRF with a lower limit of detection of 0.7 mg/kg Nb. Approximately 97% of the total variability within the Nb data can be attributed to natural geochemical differences between sites, meaning that the variability due to sampling, sample preparation and analytical procedures is approximately 3%; this was estimated using a nested analysis of variance (ANOVA) procedure based on 387 sets of field duplicate and lab replicate samples. Measurement precision, which was estimated from the coefficients of variation (CV) of repeated analyses of certified reference materials (CRMs), is approximately 4%.
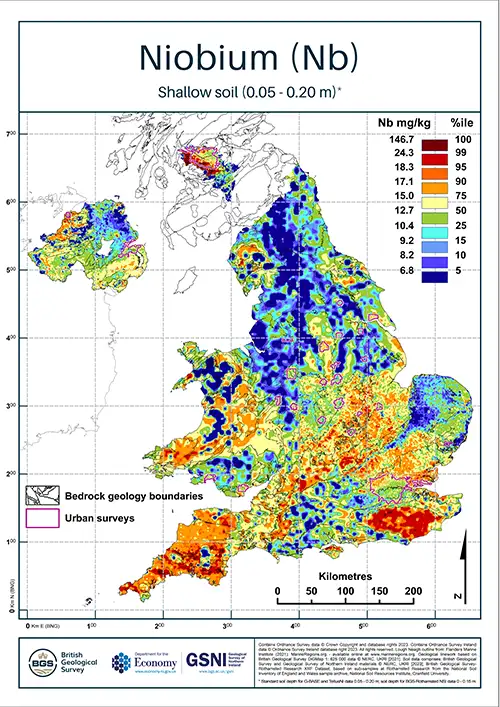
| Title | Compiled topsoil niobium (Nb) concentrations |
|---|---|
| Source | British Geological Survey |
| Enquiries | enquiries@bgs.ac.uk |
| Scale(s) | 500m grid resolution |
| Coverage | England, Wales, Northern Ireland and Clyde Basin |
| Formats and download |
Download GeoTIFF (zip) Download .png files with and without urban survey outlines (zip) |
| Price | Free for use under Open Government Licence terms |
| Uses | Local to national level use |
| Map portal | Access in UKSO Map portal |
| WMS | WMS feed |
Phosphorus concentrations (presented as P2O5 and with units in w%), were determined by XRF with a lower limit of detection of 0.01 wt% P2O5. Approximately 89% of the total variability within the P2O5 data can be attributed to natural geochemical differences between sites, meaning that the variability due to sampling, sample preparation and analytical procedures is approximately 11%; this was estimated usingp a nested analysis of variance (ANOVA) procedure based on 450 sets of field duplicate and lab replicate samples. Measurement precision, which was estimated from the coefficients of variation (CV) of repeated analyses of certified reference materials (CRMs), is approximately 8%.
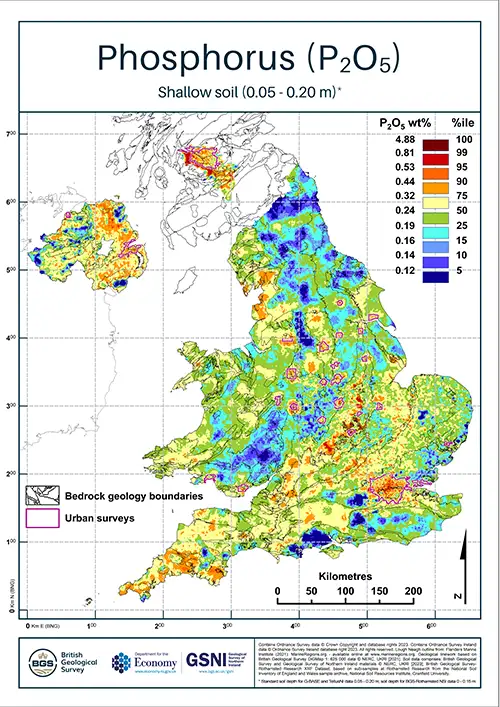
| Title | Compiled topsoil phosphorus (P2O5) concentrations |
|---|---|
| Source | British Geological Survey |
| Enquiries | enquiries@bgs.ac.uk |
| Scale(s) | 500m grid resolution |
| Coverage | England, Wales, Northern Ireland and Clyde Basin |
| Formats and download |
Download GeoTIFF (zip) Download .png files with and without urban survey outlines (zip) |
| Price | Free for use under Open Government Licence terms |
| Uses | Local to national level use |
| Map portal | Access in UKSO Map portal |
| WMS | WMS feed |
Potassium concentrations (presented as K2O and with units in w%), were determined by XRF with a lower limit of detection of 0.007 wt% K2O. Approximately 96% of the total variability within the K2O data can be attributed to natural geochemical differences between sites, meaning that the variability due to sampling, sample preparation and analytical procedures is approximately 4%; this was estimated using a nested analysis of variance (ANOVA) procedure based on 387 sets of field duplicate and lab replicate samples. Measurement precision, which was estimated from the coefficients of variation (CV) of repeated analyses of certified reference materials (CRMs), is approximately 3%.
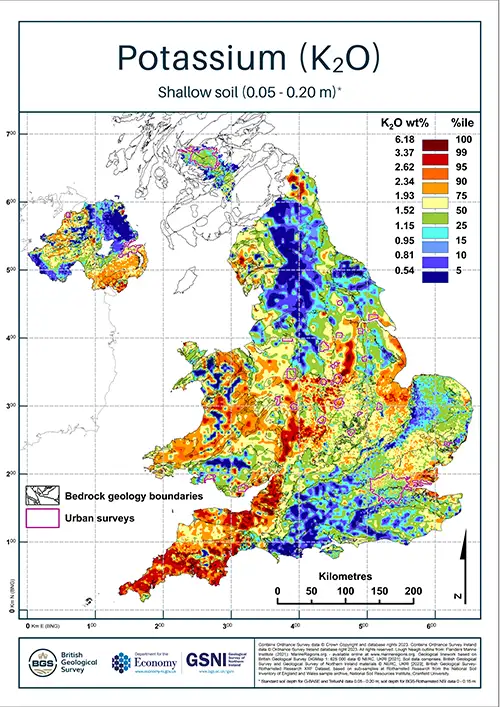
| Title | Compiled topsoil potassium (K2O) concentrations |
|---|---|
| Source | British Geological Survey |
| Enquiries | enquiries@bgs.ac.uk |
| Scale(s) | 500m grid resolution |
| Coverage | England, Wales, Northern Ireland and Clyde Basin |
| Formats and download |
Download GeoTIFF (zip) Download .png files with and without urban survey outlines (zip) |
| Price | Free for use under Open Government Licence terms |
| Uses | Local to national level use |
| Map portal | Access in UKSO Map portal |
| WMS | WMS feed |
Rubidium concentrations (presented as Rb and with units in mg/kg), were determined by XRF with a lower limit of detection of 0.7 mg/kg Rb. Approximately 95% of the total variability within the Rb data can be attributed to natural geochemical differences between sites, meaning that the variability due to sampling, sample preparation and analytical procedures is approximately 5%; this was estimated using a nested analysis of variance (ANOVA) procedure based on 450 sets of field duplicate and lab replicate samples. Measurement precision, which was estimated from the coefficients of variation (CV) of repeated analyses of certified reference materials (CRMs), is approximately 2%.
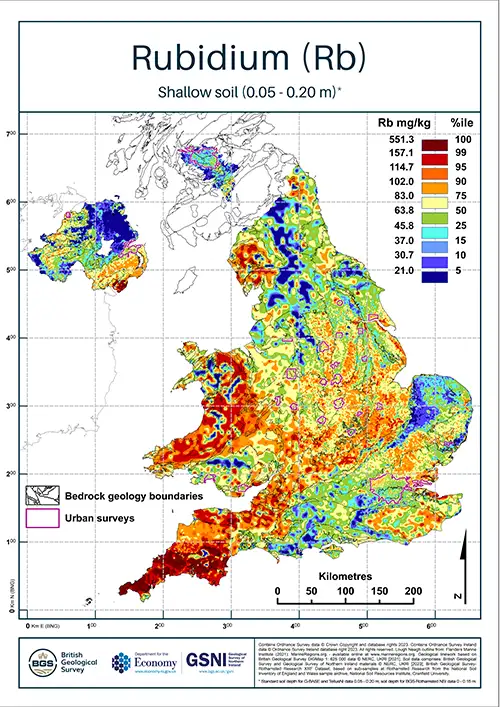
| Title | Compiled topsoil rubidium (Rb) concentrations |
|---|---|
| Source | British Geological Survey |
| Enquiries | enquiries@bgs.ac.uk |
| Scale(s) | 500m grid resolution |
| Coverage | England, Wales, Northern Ireland and Clyde Basin |
| Formats and download |
Download GeoTIFF (zip) Download .png files with and without urban survey outlines (zip) |
| Price | Free for use under Open Government Licence terms |
| Uses | Local to national level use |
| Map portal | Access in UKSO Map portal |
| WMS | WMS feed |
Scandium concentrations (presented as Sc and with units in mg/kg), were determined by XRF with a lower limit of detection of 2.4 mg/kg Sc. Approximately 84% of the total variability within the Sc data can be attributed to natural geochemical differences between sites, meaning that the variability due to sampling, sample preparation and analytical procedures is approximately 16%; this was estimated using a nested analysis of variance (ANOVA) procedure based on 368 sets of field duplicate and lab replicate samples. Measurement precision, which was estimated from the coefficients of variation (CV) of repeated analyses of certified reference materials (CRMs), is approximately 11%.
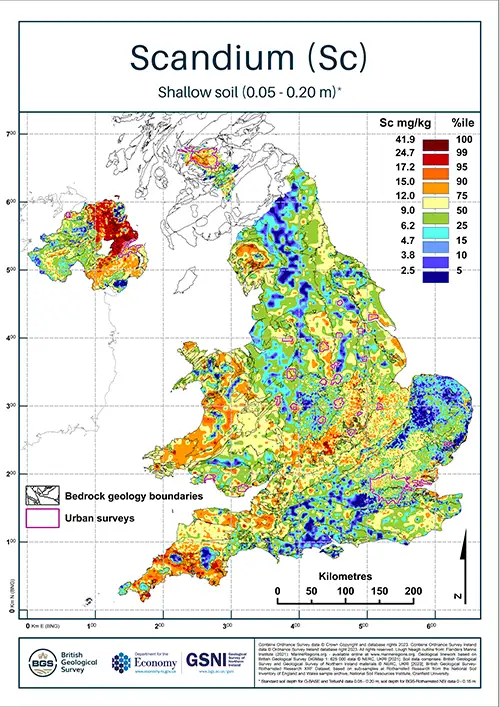
| Title | Compiled topsoil scandium (Sc) concentrations |
|---|---|
| Source | British Geological Survey |
| Enquiries | enquiries@bgs.ac.uk |
| Scale(s) | 500m grid resolution |
| Coverage | England, Wales, Northern Ireland and Clyde Basin |
| Formats and download |
Download GeoTIFF (zip) Download .png files with and without urban survey outlines (zip) |
| Price | Free for use under Open Government Licence terms |
| Uses | Local to national level use |
| Map portal | Access in UKSO Map portal |
| WMS | WMS feed |
Selenium concentrations (presented as Se and with units in mg/kg), were determined by XRF with a lower limit of detection of 0.1 mg/kg Se. Approximately 76% of the total variability within the Se data can be attributed to natural geochemical differences between sites, meaning that the variability due to sampling, sample preparation and analytical procedures is approximately 24%; this was estimated using a nested analysis of variance (ANOVA) procedure based on 417 sets of field duplicate and lab replicate samples. Measurement precision, which was estimated from the coefficients of variation (CV) of repeated analyses of certified reference materials (CRMs), is approximately 34%.
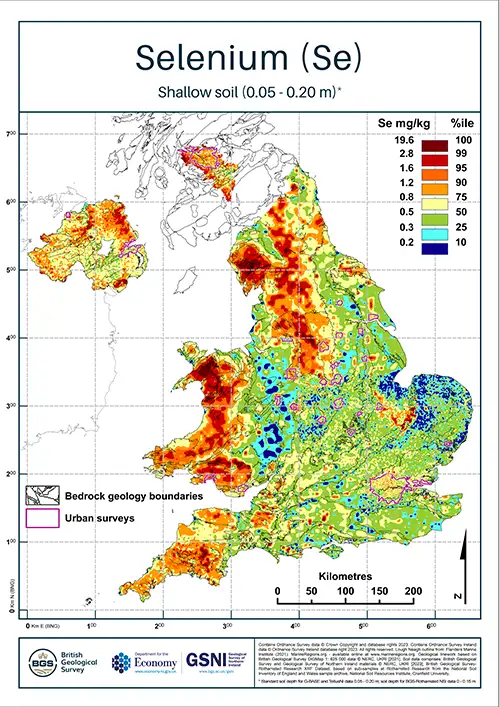
| Title | Compiled topsoil selenium (Se) concentrations |
|---|---|
| Source | British Geological Survey |
| Enquiries | enquiries@bgs.ac.uk |
| Scale(s) | 500m grid resolution |
| Coverage | England, Wales, Northern Ireland and Clyde Basin |
| Formats and download |
Download GeoTIFF (zip) Download .png files with and without urban survey outlines (zip) |
| Price | Free for use under Open Government Licence terms |
| Uses | Local to national level use |
| Map portal | Access in UKSO Map portal |
| WMS | WMS feed |
Silicon concentrations (presented as SiO2 and with units in w%), were determined by XRF with a lower limit of detection of 0.02 wt% SiO2. Approximately 93% of the total variability within the SiO2 data can be attributed to natural geochemical differences between sites, meaning that the variability due to sampling, sample preparation and analytical procedures is approximately 7%; this was estimated using a nested analysis of variance (ANOVA) procedure based on 387 sets of field duplicate and lab replicate samples. Measurement precision, which was estimated from the coefficients of variation (CV) of repeated analyses of certified reference materials (CRMs), is approximately 5%.

| Title | Compiled topsoil silicon (SiO2) concentrations |
|---|---|
| Source | British Geological Survey |
| Enquiries | enquiries@bgs.ac.uk |
| Scale(s) | 500m grid resolution |
| Coverage | England, Wales, Northern Ireland and Clyde Basin |
| Formats and download |
Download GeoTIFF (zip) Download .png files with and without urban survey outlines (zip) |
| Price | Free for use under Open Government Licence terms |
| Uses | Local to national level use |
| Map portal | Access in UKSO Map portal |
| WMS | WMS feed |
Sodium concentrations (presented as Na2O and with units in w%), were determined by XRF with a lower limit of detection of 0.2 wt% Na2O. Approximately 93% of the total variability within the Na2O data can be attributed to natural geochemical differences between sites, meaning that the variability due to sampling, sample preparation and analytical procedures is approximately 7%; this was estimated using a nested analysis of variance (ANOVA) procedure based on 307 sets of field duplicate and lab replicate samples. Measurement precision, which was estimated from the coefficients of variation (CV) of repeated analyses of certified reference materials (CRMs), is approximately 7%.
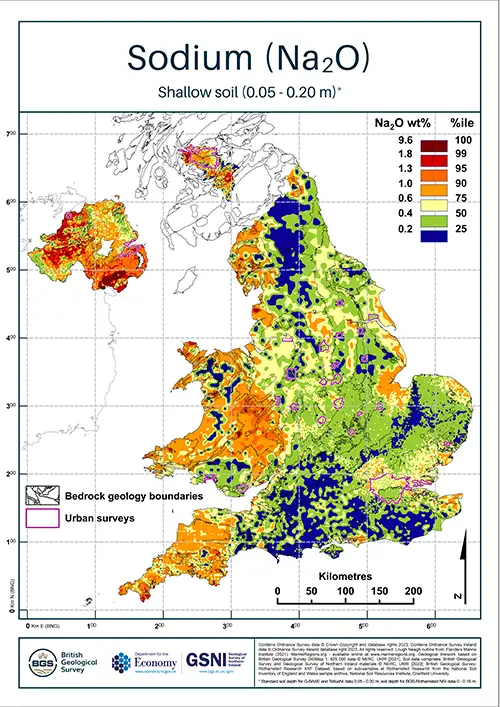
| Title | Compiled topsoil sodium (Na2O) concentrations |
|---|---|
| Source | British Geological Survey |
| Enquiries | enquiries@bgs.ac.uk |
| Scale(s) | 500m grid resolution |
| Coverage | England, Wales, Northern Ireland and Clyde Basin |
| Formats and download |
Download GeoTIFF (zip) Download .png files with and without urban survey outlines (zip) |
| Price | Free for use under Open Government Licence terms |
| Uses | Local to national level use |
| Map portal | Access in UKSO Map portal |
| WMS | WMS feed |
Strontium concentrations (presented as Sr and with units in mg/kg), were determined by XRF with a lower limit of detection of 0.8 mg/kg Sr. Approximately 93% of the total variability within the Sr data can be attributed to natural geochemical differences between sites, meaning that the variability due to sampling, sample preparation and analytical procedures is approximately 7%; this was estimated using a nested analysis of variance (ANOVA) procedure based on 450 sets of field duplicate and lab replicate samples. Measurement precision, which was estimated from the coefficients of variation (CV) of repeated analyses of certified reference materials (CRMs), is approximately 1%.
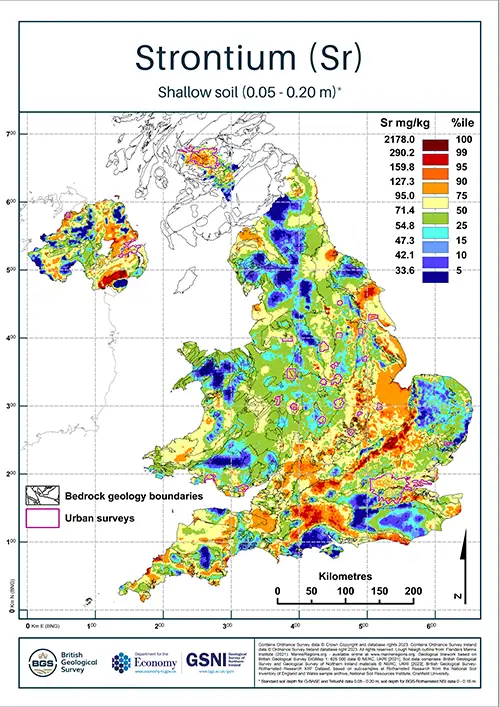
| Title | Compiled topsoil strontium (Sr) concentrations |
|---|---|
| Source | British Geological Survey |
| Enquiries | enquiries@bgs.ac.uk |
| Scale(s) | 500m grid resolution |
| Coverage | England, Wales, Northern Ireland and Clyde Basin |
| Formats and download |
Download GeoTIFF (zip) Download .png files with and without urban survey outlines (zip) |
| Price | Free for use under Open Government Licence terms |
| Uses | Local to national level use |
| Map portal | Access in UKSO Map portal |
| WMS | WMS feed |
Thorium concentrations (presented as Th and with units in mg/kg), were determined by XRF with a lower limit of detection of 0.7 mg/kg Th. Approximately 92% of the total variability within the Th data can be attributed to natural geochemical differences between sites, meaning that the variability due to sampling, sample preparation and analytical procedures is approximately 8%; this was estimated using a nested analysis of variance (ANOVA) procedure based on 387 sets of field duplicate and lab replicate samples. Measurement precision, which was estimated from the coefficients of variation (CV) of repeated analyses of certified reference materials (CRMs), is approximately 8%.
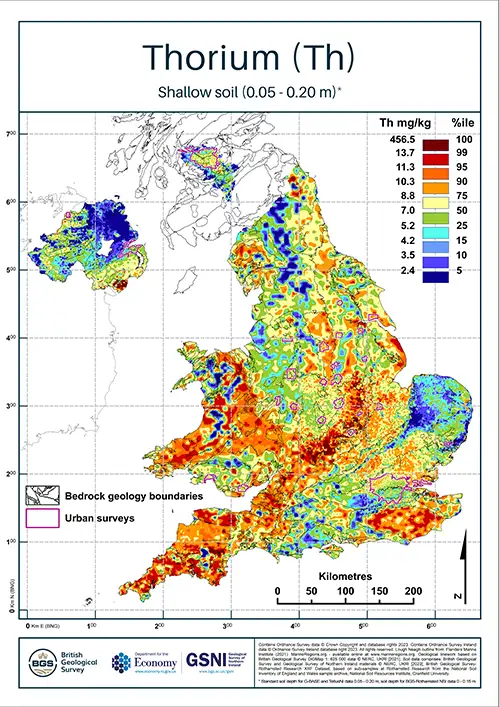
| Title | Compiled topsoil thorium (Th) concentrations |
|---|---|
| Source | British Geological Survey |
| Enquiries | enquiries@bgs.ac.uk |
| Scale(s) | 500m grid resolution |
| Coverage | England, Wales, Northern Ireland and Clyde Basin |
| Formats and download |
Download GeoTIFF (zip) Download .png files with and without urban survey outlines (zip) |
| Price | Free for use under Open Government Licence terms |
| Uses | Local to national level use |
| Map portal | Access in UKSO Map portal |
| WMS | WMS feed |
Tin concentrations (presented as Sn and with units in mg/kg), were determined by XRF with a lower limit of detection of 0.25 mg/kg Sn. Approximately 74% of the total variability within the Sn data can be attributed to natural geochemical differences between sites, meaning that the variability due to sampling, sample preparation and analytical procedures is approximately 26%; this was estimated using a nested analysis of variance (ANOVA) procedure based on 437 sets of field duplicate and lab replicate samples. Measurement precision, which was estimated from the coefficients of variation (CV) of repeated analyses of certified reference materials (CRMs), is approximately 5%.
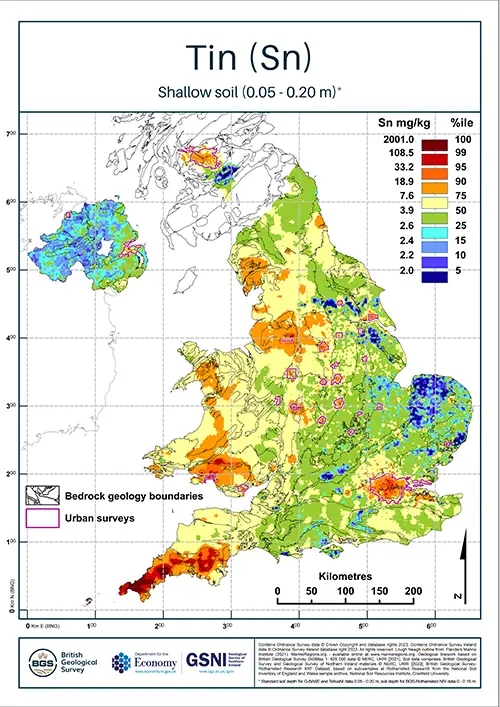
| Title | Compiled topsoil tin (Sn) concentrations |
|---|---|
| Source | British Geological Survey |
| Enquiries | enquiries@bgs.ac.uk |
| Scale(s) | 500m grid resolution |
| Coverage | England, Wales, Northern Ireland and Clyde Basin |
| Formats and download |
Download GeoTIFF (zip) Download .png files with and without urban survey outlines (zip) |
| Price | Free for use under Open Government Licence terms |
| Uses | Local to national level use |
| Map portal | Access in UKSO Map portal |
| WMS | WMS feed |
Titanium concentrations (presented as TiO2 and with units in w%), were determined by XRF with a lower limit of detection of 0.004 wt% TiO2. Approximately 97% of the total variability within the TiO2 data can be attributed to natural geochemical differences between sites, meaning that the variability due to sampling, sample preparation and analytical procedures is approximately 3%; this was estimated using a nested analysis of variance (ANOVA) procedure based on 450 sets of field duplicate and lab replicate samples. Measurement precision, which was estimated from the coefficients of variation (CV) of repeated analyses of certified reference materials (CRMs), is approximately 2%.
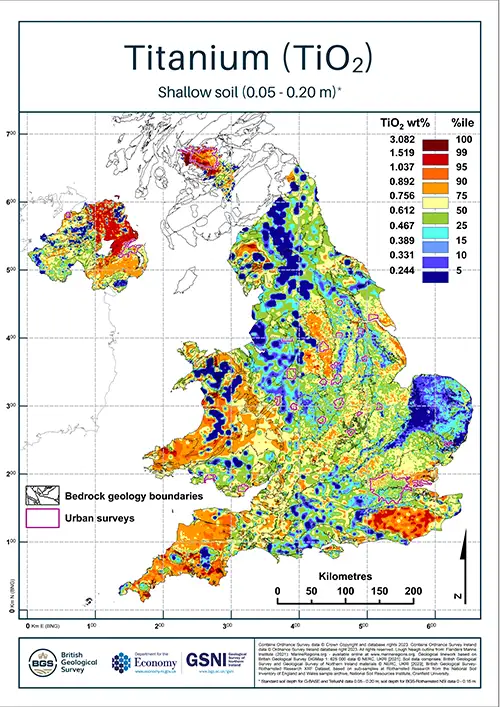
| Title | Compiled topsoil titanium (TiO2) concentrations |
|---|---|
| Source | British Geological Survey |
| Enquiries | enquiries@bgs.ac.uk |
| Scale(s) | 500m grid resolution |
| Coverage | England, Wales, Northern Ireland and Clyde Basin |
| Formats and download |
Download GeoTIFF (zip) Download .png files with and without urban survey outlines (zip) |
| Price | Free for use under Open Government Licence terms |
| Uses | Local to national level use |
| Map portal | Access in UKSO Map portal |
| WMS | WMS feed |
Tungsten concentrations (presented as W and with units in mg/kg), were determined by XRF with a lower limit of detection of 0.6 mg/kg W. Approximately 76% of the total variability within the W data can be attributed to natural geochemical differences between sites, meaning that the variability due to sampling, sample preparation and analytical procedures is approximately 24%; this was estimated using a nested analysis of variance (ANOVA) procedure based on 368 sets of field duplicate and lab replicate samples. Measurement precision, which was estimated from the coefficients of variation (CV) of repeated analyses of certified reference materials (CRMs), is approximately 18%.
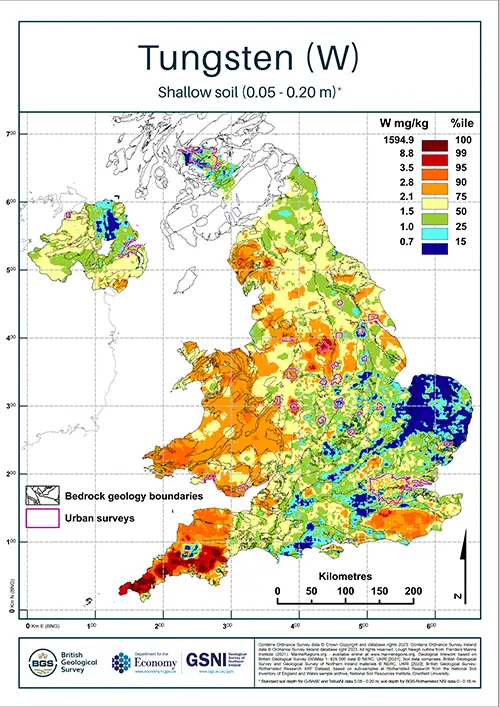
| Title | Compiled topsoil tungsten (W) concentrations |
|---|---|
| Source | British Geological Survey |
| Enquiries | enquiries@bgs.ac.uk |
| Scale(s) | 500m grid resolution |
| Coverage | England, Wales, Northern Ireland and Clyde Basin |
| Formats and download |
Download GeoTIFF (zip) Download .png files with and without urban survey outlines (zip) |
| Price | Free for use under Open Government Licence terms |
| Uses | Local to national level use |
| Map portal | Access in UKSO Map portal |
| WMS | WMS feed |
Uranium concentrations (presented as U and with units in mg/kg), were determined by XRF with a lower limit of detection of 0.2 mg/kg U. Approximately 74% of the total variability within the U data can be attributed to natural geochemical differences between sites, meaning that the variability due to sampling, sample preparation and analytical procedures is approximately 26%; this was estimated using a nested analysis of variance (ANOVA) procedure based on 440 sets of field duplicate and lab replicate samples. Measurement precision, which was estimated from the coefficients of variation (CV) of repeated analyses of certified reference materials (CRMs), is approximately 21%.
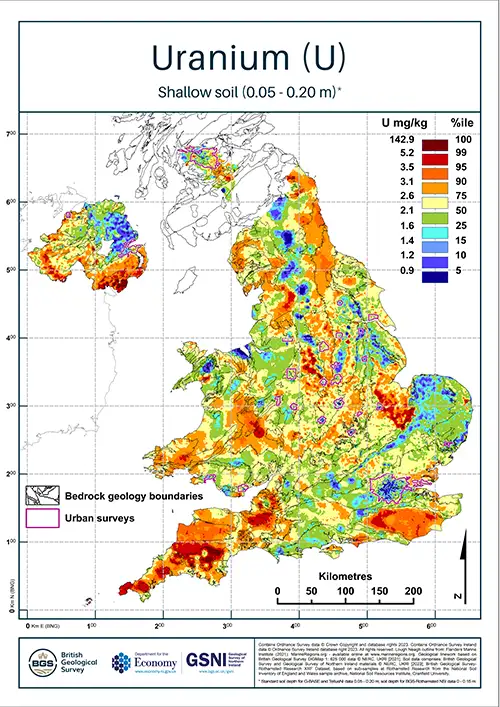
| Title | Compiled topsoil uranium (U) concentrations |
|---|---|
| Source | British Geological Survey |
| Enquiries | enquiries@bgs.ac.uk |
| Scale(s) | 500m grid resolution |
| Coverage | England, Wales, Northern Ireland and Clyde Basin |
| Formats and download |
Download GeoTIFF (zip) Download .png files with and without urban survey outlines (zip) |
| Price | Free for use under Open Government Licence terms |
| Uses | Local to national level use |
| Map portal | Access in UKSO Map portal |
| WMS | WMS feed |
Vanadium concentrations (presented as V and with units in mg/kg), were determined by XRF with a lower limit of detection of 2.7 mg/kg V. Approximately 95% of the total variability within the V data can be attributed to natural geochemical differences between sites, meaning that the variability due to sampling, sample preparation and analytical procedures is approximately 5%; this was estimated using a nested analysis of variance (ANOVA) procedure based on 450 sets of field duplicate and lab replicate samples. Measurement precision, which was estimated from the coefficients of variation (CV) of repeated analyses of certified reference materials (CRMs), is approximately 3%.
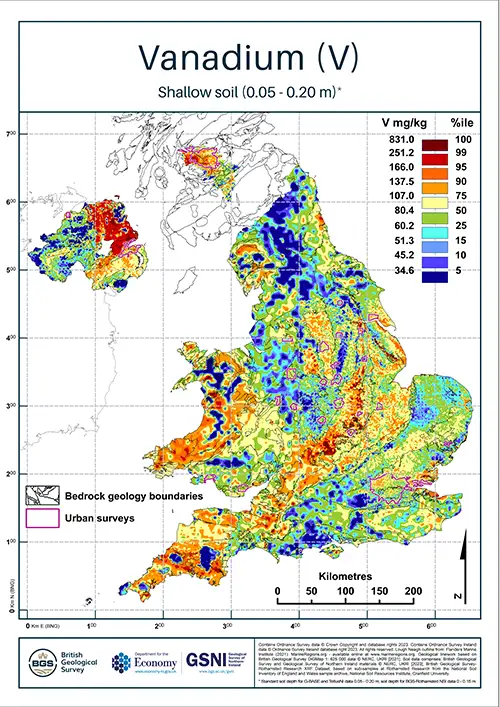
| Title | Compiled topsoil vanadium (V) concentrations |
|---|---|
| Source | British Geological Survey |
| Enquiries | enquiries@bgs.ac.uk |
| Scale(s) | 500m grid resolution |
| Coverage | England, Wales, Northern Ireland and Clyde Basin |
| Formats and download |
Download GeoTIFF (zip) Download .png files with and without urban survey outlines (zip) |
| Price | Free for use under Open Government Licence terms |
| Uses | Local to national level use |
| Map portal | Access in UKSO Map portal |
| WMS | WMS feed |
Yttrium concentrations (presented as Y and with units in mg/kg), were determined by XRF with a lower limit of detection of 0.8 mg/kg Y. Approximately 95% of the total variability within the Y data can be attributed to natural geochemical differences between sites, meaning that the variability due to sampling, sample preparation and analytical procedures is approximately 5%; this was estimated using a nested analysis of variance (ANOVA) procedure based on 410 sets of field duplicate and lab replicate samples. Measurement precision, which was estimated from the coefficients of variation (CV) of repeated analyses of certified reference materials (CRMs), is approximately 3%.
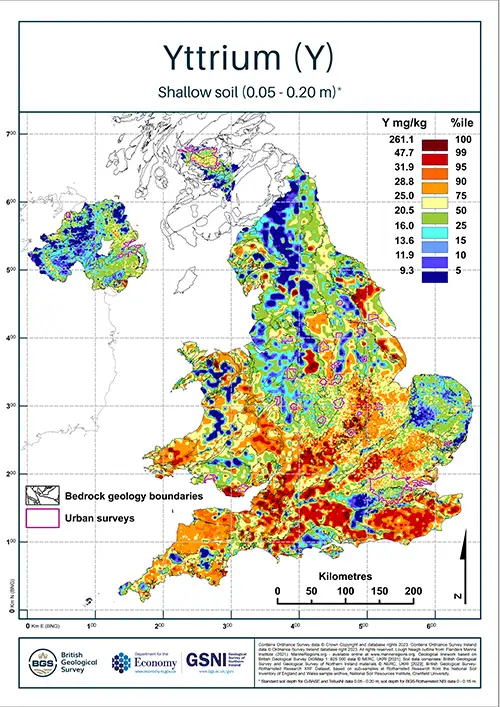
| Title | Compiled topsoil yttrium (Y) concentrations |
|---|---|
| Source | British Geological Survey |
| Enquiries | enquiries@bgs.ac.uk |
| Scale(s) | 500m grid resolution |
| Coverage | England, Wales, Northern Ireland and Clyde Basin |
| Formats and download |
Download GeoTIFF (zip) Download .png files with and without urban survey outlines (zip) |
| Price | Free for use under Open Government Licence terms |
| Uses | Local to national level use |
| Map portal | Access in UKSO Map portal |
| WMS | WMS feed |
Zinc concentrations (presented as Zn and with units in mg/kg), were determined by XRF with a lower limit of detection of 1.1 mg/kg Zn. Approximately 88% of the total variability within the Zn data can be attributed to natural geochemical differences between sites, meaning that the variability due to sampling, sample preparation and analytical procedures is approximately 12%; this was estimated using a nested analysis of variance (ANOVA) procedure based on 450 sets of field duplicate and lab replicate samples. Measurement precision, which was estimated from the coefficients of variation (CV) of repeated analyses of certified reference materials (CRMs), is approximately 2%.
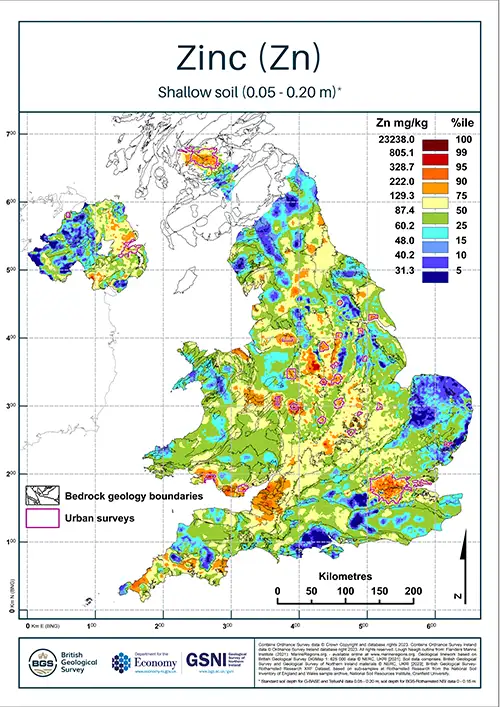
| Title | Compiled topsoil zinc (Zn) concentrations |
|---|---|
| Source | British Geological Survey |
| Enquiries | enquiries@bgs.ac.uk |
| Scale(s) | 500m grid resolution |
| Coverage | England, Wales, Northern Ireland and Clyde Basin |
| Formats and download |
Download GeoTIFF (zip) Download .png files with and without urban survey outlines (zip) |
| Price | Free for use under Open Government Licence terms |
| Uses | Local to national level use |
| Map portal | Access in UKSO Map portal |
| WMS | WMS feed |
Zirconium concentrations (presented as Zr and with units in mg/kg), were determined by XRF with a lower limit of detection of 0.8 mg/kg Zr. Approximately 92% of the total variability within the Zr data can be attributed to natural geochemical differences between sites, meaning that the variability due to sampling, sample preparation and analytical procedures is approximately 8%; this was estimated using a nested analysis of variance (ANOVA) procedure based on 450 sets of field duplicate and lab replicate samples. Measurement precision, which was estimated from the coefficients of variation (CV) of repeated analyses of certified reference materials (CRMs), is approximately 2%.
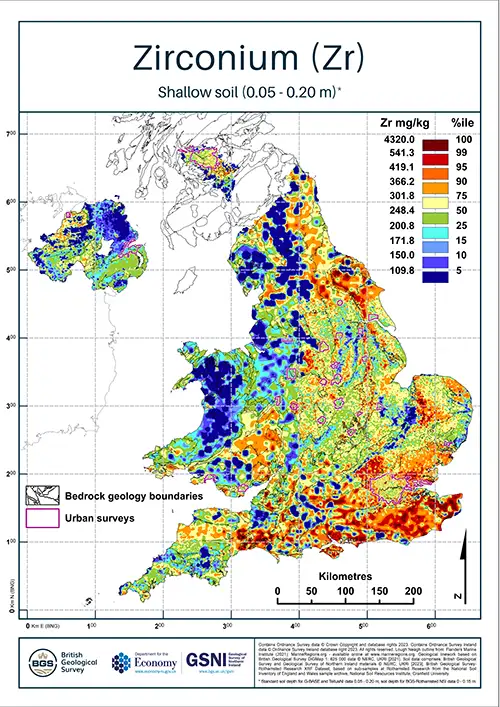
| Title | Compiled topsoil zirconium (Zr) concentrations |
|---|---|
| Source | British Geological Survey |
| Enquiries | enquiries@bgs.ac.uk |
| Scale(s) | 500m grid resolution |
| Coverage | England, Wales, Northern Ireland and Clyde Basin |
| Formats and download |
Download GeoTIFF (zip) Download .png files with and without urban survey outlines (zip) |
| Price | Free for use under Open Government Licence terms |
| Uses | Local to national level use |
| Map portal | Access in UKSO Map portal |
| WMS | WMS feed |