Select an option from the list below to view high resolution images and data about soils across Scotland.
The national soil and soil properties maps for Scotland have been developed by the James Hutton Institute. The maps include the primary 1:250 000 soil map as well as a series of thematic soil properties including pH, total organic carbon content, available water capacity, soil texture and land capability for agriculture. These property maps have been created using the 1:250 000 scale national soil map of Scotland, coupled with sample analyses from the Scottish soils knowledge and information base (SSKIB) and using pedotransfer modelling techniques where appropriate.
The 1:250 000 scale national soil map of Scotland, coupled with sample analyses from the Scottish soils knowledge and information base (SSKIB), underpin soil research in Scotland. Click on a gallery image to view high resolution images and discover further information about the soils of Scotland, including their soil type, pH, total organic carbon content, available water capacity, soil texture and land capability for agriculture.
These data are delivered under the terms of the Open Government Licence, subject to the following acknowledgement accompanying the reproduced James Hutton Institute materials: "Contains James Hutton Institute materials © [year]".
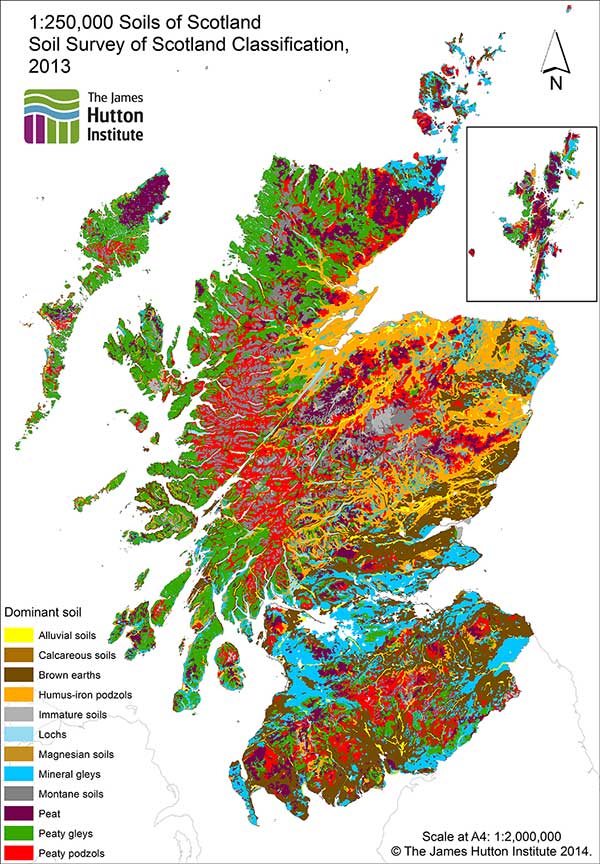
The 1:250 000 scale national soil map of Scotland, in a series of seven paper maps, was derived from a mixture of new soil survey work undertaken between 1978 and 1981 and a simplification of more detailed mapping undertaken between 1947 and 1978. The soil map units are mainly soil 'complexes' based on a limited number of repeated landforms found throughout Scotland and, as such, often comprise of more than one particular soil type. A set of handbooks give additional information of the distribution of the individual soil types within these map units. The soils polygons on this series of maps were subsequently digitised to produce this digital dataset of Scotland.
Use of the dataset in combination with more detailed mapping revealed a problem with the registration of some water bodies. These were corrected in 2012 and a new version of the 1:250 000 scale national soil map of Scotland was released. The soil classification used was updated in 2013 to provide a unified classification across all Soil Survey of Scotland soil maps and profile datasets (UCSS). This version 1.1 of the data includes both the original 1984 and the 2013 soil classification.
| Title | Soils of Scotland |
|---|---|
| Source | The James Hutton Institute |
| Enquiries | info@hutton.ac.uk |
| Scale(s) | 1:250 000 |
| Coverage | Scotland |
| Format | GIS point data |
| Price | Data can be downloaded for free under an Open Data licence from Scotland's soils website |
| Uses | Local to national level use |
| Map Viewer | View in UKSO Map Viewer |
| WMS link | http://druid.hutton.ac.uk/... |
| Images | High resolution | low resolution |
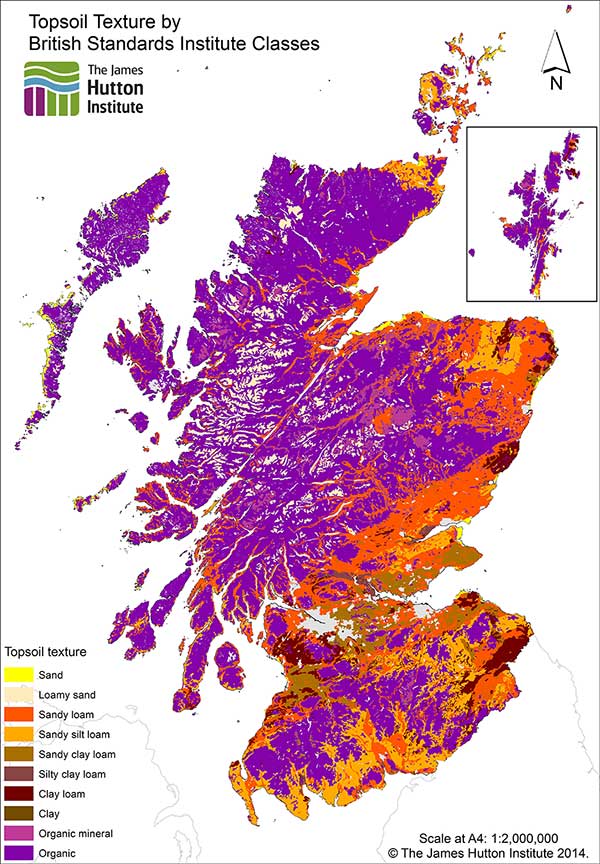
This topsoil texture dataset is based on the digital (vector) version of the soils of Scotland 1:250 000 maps and the land cover of Scotland 1988.
The topsoil texture in this data set has been determined using data from the Scottish soils knowledge and information base (SSKIB). The component sand, silt and clay contents held within SSKIB are derived from a subset from over 40 000 analyses held within the Scottish soils database. The median, silt and clay contents were calculated for each soil horizon of each soil taxonomic unit (soil series) delineated within the 1:250 000 national soil map of Scotland, using only data from those horizons that matched the typical horizon sequences for each taxonomic unit. The percentage of sand-sized particles was derived by subtraction the percentage of silt plus clay from 100. Where no data was available, information from analogous (similar) soil series (taxonomic units) were used. The data are presented in British Standards Institute texture classes (BRITISH STANDARDS INSTITUTION. Code of Practice for Site Investigations. BS5930:1981 Second Edition. British Standards Institution, London, 1981) and are applied to the dominant soil type within a map unit.
| Title | Topsoil texture |
|---|---|
| Source | The James Hutton Institute |
| Enquiries | info@hutton.ac.uk |
| Scale(s) | 1:250 000 |
| Coverage | Scotland |
| Format | GIS point data |
| Price | Data can be downloaded for free under an Open Data licence from Scotland's soils website |
| Uses | Local to national level use |
| Map Viewer | View in UKSO Map Viewer |
| WMS link | http://druid.hutton.ac.uk/... |
| Images | High resolution | low resolution |
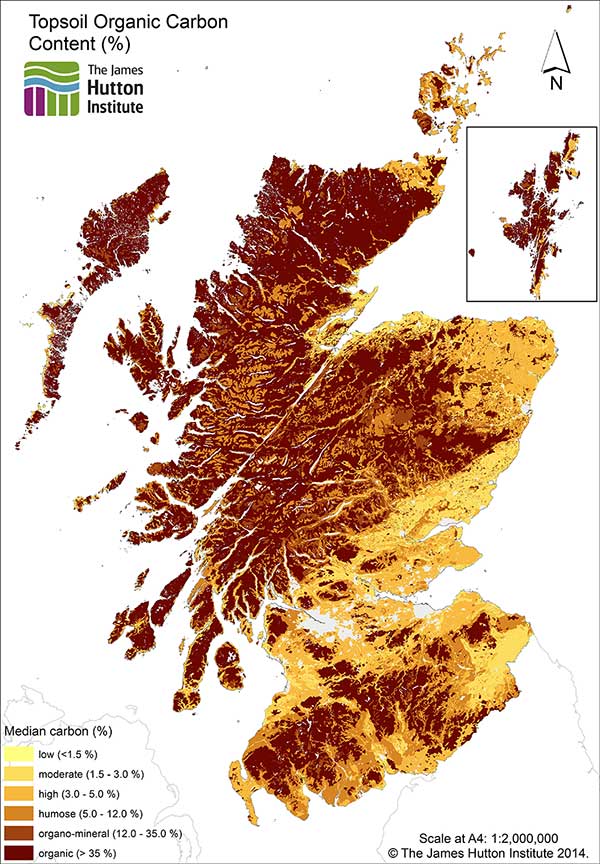
This soil organic carbon dataset is based on the digital (vector) version of the soils of Scotland 1:250 000 maps and the land cover of Scotland 1988.
The topsoil carbon percentage in this dataset has been computed using data from the Scottish soils knowledge and information base (SSKIB). The soil carbon contents (and other chemical data) held within SSKIB are derived from a subset from over 40 000 analyses held within the Scottish soils database. The median carbon contents were calculated for each soil horizon of each soil taxonomic unit (soil series) delineated within the 1:250 000 national soil map of Scotland, using only data from those horizons that matched the typical horizon sequences for each taxonomic unit. Where carbon data were missing or were below the detection limit, the carbon contents were firstly estimated from the loss on ignition values using regression equations derived from the data for mineral and for organic horizons. If this was not possible the detection limit was allocated to these horizons. Where no data were available, information from analogous (similar) soil series (taxonomic units) were used. The map shows the organic carbon content of the most extensive soil in each 1:250 000 soil map unit.
Lilly, A, Baggaley, N and Donnelly, D. 2012. Map of soil organic carbon in top soils of Scotland. Map prepared for EU project GS-SOIL -Assessment and strategic development of INSPIRE compliant Geodata-Services for European Soil Data. ECP-2008-GEO-318004.
| Title | Topsoil organic carbon content |
|---|---|
| Source | The James Hutton Institute |
| Enquiries | info@hutton.ac.uk |
| Scale(s) | 1:250 000 |
| Coverage | Scotland |
| Format | GIS point data |
| Price | Data can be downloaded for free under an Open Data licence from Scotland's soils website |
| Uses | Local to national level use |
| Map Viewer | View in UKSO Map Viewer |
| WMS link | http://druid.hutton.ac.uk/... |
| Images | High resolution | low resolution |
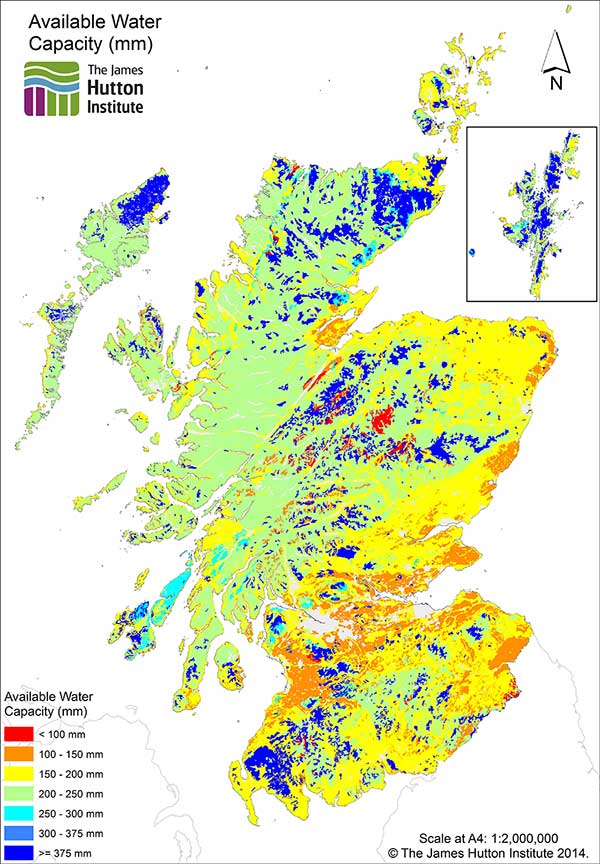
This available water capacity dataset is based on the digital (vector) version of the soils of Scotland 1:250 000 maps and the land cover of Scotland 1988 (MLURI, 1993). The field capacity and permanent wilting point values in this data set have been calculated for each soil horizon of each soil taxonomic unit (soil series) delineated within the 1:250 000 national soil map of Scotland based on pedotransfer functions (regression equations) derived for soils in Scotland, Wales and England (Cranfield University, 2008). The pedotransfer functions used the median sand, silt, clay and organic carbon contents from the Scottish soils knowledge and information base (SSKIB) and predicted bulk densities. The map shows the available water capacity of the most extensive soil in each 1:250 000 soil map unit.
Lilly, A, Baggaley, N and Donnelly, D. 2012. Map of available water content to 1 metre depth in soils of Scotland. Map prepared for EU project GS-SOIL-Assessment and strategic development of INSPIRE compliant Geodata-Services for European Soil Data. ECP-2008-GEO-318004.
| Title | Available water capacity |
|---|---|
| Source | The James Hutton Institute |
| Enquiries | info@hutton.ac.uk |
| Scale(s) | 1:250 000 |
| Coverage | Scotland |
| Format | GIS point data |
| Price | Data can be downloaded for free under an Open Data licence from Scotland's soils website |
| Uses | Local to national level use |
| Map Viewer | View in UKSO Map Viewer |
| WMS link | http://druid.hutton.ac.uk/... |
| Images | High resolution | low resolution |
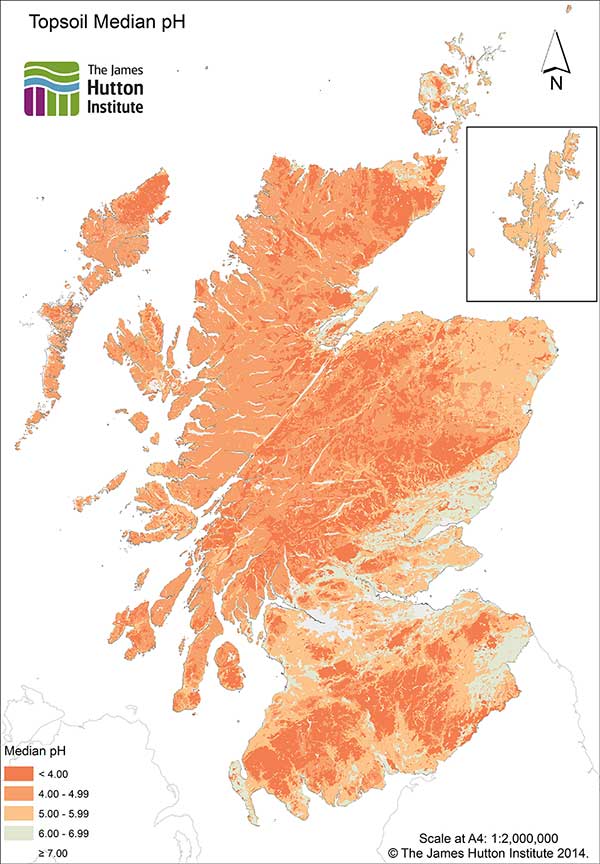
This topsoil pH dataset is based on the digital (vector) version of the soils of Scotland 1:250 000 maps and the land cover of Scotland 1988.
The topsoil pH in this data set has been computed using data from the Scottish soils knowledge and information base (SSKIB). The soil pH values held within SSKIB are derived from a subset from over 40 000 analyses held within the Scottish soils database. The median pH values were calculated for each soil horizon of each soil taxonomic unit (soil series) delineated within the 1:250 000 national soil map of Scotland, using only data from those horizons that matched the typical horizon sequences for each taxonomic unit. Where no data were available, information from analogous (similar) soil series (taxonomic units) were used. The map shows the pH of the uppermost major horizon of the most extensive soil in each 1:250 000 soil map unit.
| Title | Topsoil pH |
|---|---|
| Source | The James Hutton Institute |
| Enquiries | info@hutton.ac.uk |
| Scale(s) | 1:250 000 |
| Coverage | Scotland |
| Format | GIS point data |
| Price | Data can be downloaded for free under an Open Data licence from Scotland's soils website |
| Uses | Local to national level use |
| Map Viewer | View in UKSO Map Viewer |
| WMS link | http://druid.hutton.ac.uk/... |
| Images | High resolution | low resolution |
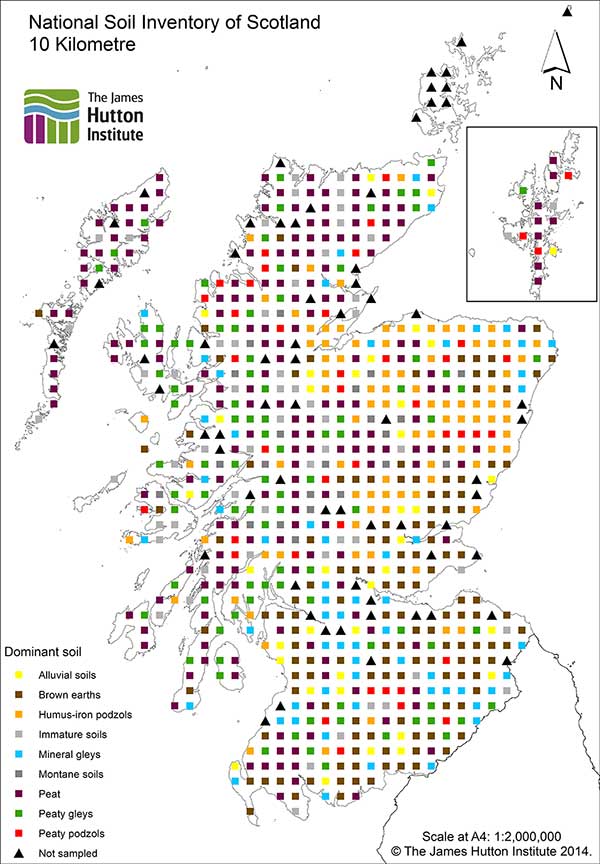
The National Soil Inventory of Scotland (1978–88) was implemented to provide statistical summaries of environmental, soil morphological and analytical data for Scottish soils.
The inventory was based on a systematic sampling scheme aligned with the Ordnance Survey national grid. The soil profiles found at each the 10 km grid intersects were described and the major soil horizons in the profile were sampled for analysis of a wide range of chemical and physical properties and, at a later date, the surface samples were analysed for a range of heavy metals. The sample frame comprised 787 locations at the 10 km spacing. Some sites were rejected during the sampling programme as they either fell on land owned by the Ministry of Defence or were found to lie below high water mark. Additionally, some sites in Orkney were not completed, giving rise to a total number of NSIS profiles of 721
Lilly A, Bell J S, Hudson G, Nolan A J and Towers W (compilers). 2010. National Soil Inventory of Scotland (1978–1988): Site location, sampling and profile description protocols. (NSIS_1). Technical Bulletin, Macaulay Institute.
| Title | National soil inventory (1978-88) |
|---|---|
| Source | The James Hutton Institute |
| Enquiries | info@hutton.ac.uk |
| Scale(s) | Point data at 10km spacing |
| Coverage | Scotland |
| Format | GIS point data |
| Price | Data can be downloaded for free under an Open Data licence from Scotland's soils website |
| Uses | Local to national level use |
| Map Viewer | View in UKSO Map Viewer |
| WMS link | http://druid.hutton.ac.uk/... |
| Images | High resolution | low resolution |
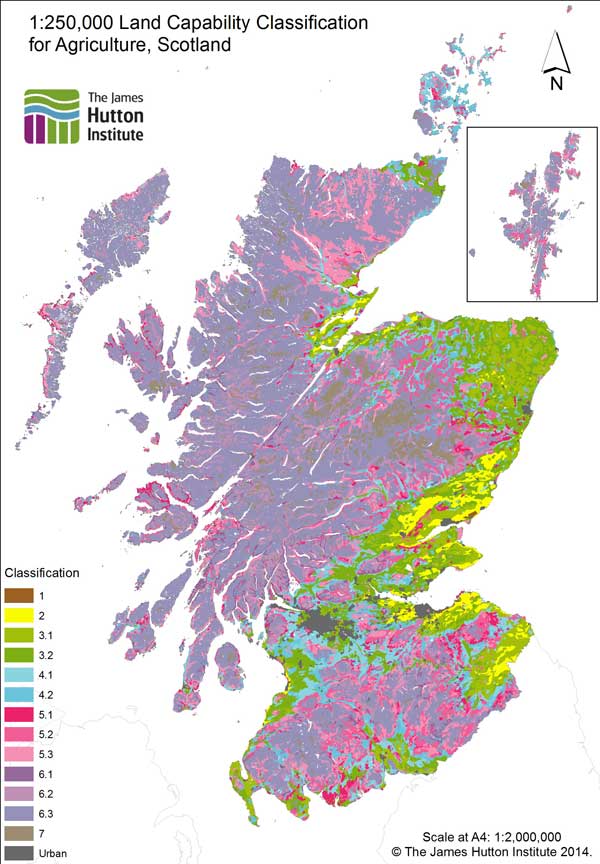
This is the national map of the land capability for agriculture of Scotland at a scale of 1:250 000.
The land capability classification for agriculture incorporates soil, climate, relief and the grazing value of semi-natural vegetation to rank land on the basis of its potential productivity and cropping flexibility determined by the extent to which these physical characteristics impose long term restrictions on its agricultural use. A key aspect is that the land is assessed on its potential rather than on current land use and assumes a moderate to high level of management. Physical factors that are more easily overcome by normal management practices such as poor drainage or low fertility are assumed not to limit the land capability. The classes range from 1–7 with class 7 land being of little agricultural value. Classes 3–6 have subdivisions.
| Title | Land capability for agriculture |
|---|---|
| Source | The James Hutton Institute |
| Enquiries | info@hutton.ac.uk |
| Scale(s) | 1:250 000 |
| Coverage | Scotland |
| Format | GIS point data |
| Price | Data can be downloaded for free under an Open Data licence from Scotland's soils website |
| Uses | Local to national level use |
| Map Viewer | View in UKSO Map Viewer |
| WMS link | http://druid.hutton.ac.uk/... |
| Images | High resolution | low resolution |