Select an option from the list below to view high resolution images and data about soils across Great Britain.
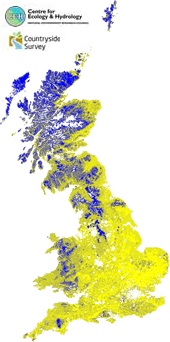
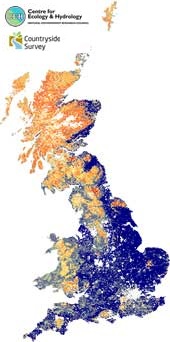
The Countryside Survey (CS) topsoil maps for Great Britain have been developed by the Centre for Ecology & Hydrology (CEH). The maps show a series of thematic soil properties including pH, bulk density, carbon, nitrogen, phosphorus and biodiversity based on topsoil data taken at 15 cm depth during the Countryside Surveys of 1978, 1998 and 2007. The topsoil properties are modelled across Great Britain using a Land Cover Map and the Parent Material Map. These data are presented as 1km2 resolution grids of information. The parent material characteristic used was that which minimised Akaike information criterion (AIC) in each model. Areas, such as urban and littoral rock, are not sampled by CS and therefore have no associated data. Also, in some circumstances sample sizes for particular habitat/parent material combinations were insufficient to estimate mean values. Where these areas occur they are left blank.
Access to and use of the data is subject to Terms and Conditions. The following acknowledgement and copyright notice (where applicable) shall, unless otherwise stated, be used on all copies of the data, publications and reports, including but not limited to use in presentations to any audience.
For use of the data in scientific and/or academic publications, accepted scientific referencing conventions will apply and you will act reasonably in carrying out such referencing.
You will ensure that citation of any relevant key publications and digital object identifiers identified in the metadata record for the data are included in full in the reference list of any reports or publications that describe any research in which the data have been used.
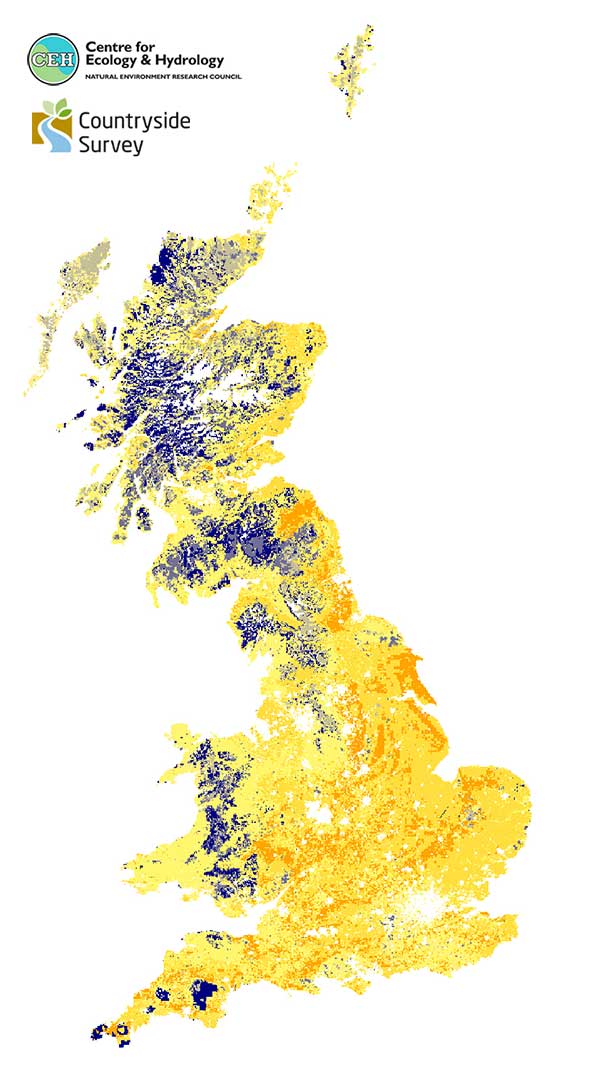
Countryside Survey (CS) topsoil bulk density (g cm-3) data is representative of 0–15cm soil depth. Bulk density was estimated by making detailed weight measurements throughout the soil processing procedure. For topsoil bulk density data, a total of 2614 cores from 591 1km x 1km squares across Great Britain were collected and analysed in 2007.
The estimated means of combinations of broad habitat/dominant grain size class using 2007 data are mapped on to the dominant habitat and dominant grain size class in each 1km x 1km2 derived from the Land Cover Map 2007 and Parent Material Model 2009.
| Title | Countryside Survey - Topsoil bulk density |
|---|---|
| Source | Centre for Ecology & Hydrology |
| Enquiries | eidc@ceh.ac.uk |
| Scale(s) | 1km grid resolution |
| Coverage | Great Britain |
| Format | ArcGIS Shape file, MITAB, ArcInfo Interchange File, GML |
| Price | The data is free for access and use upon agreement of Terms & Conditions |
| Uses | Local to national level use |
| Map Viewer | View in UKSO Map Viewer |
| WMS link | https://catalogue.ceh.ac.uk/... |
| Images | High resolution | low resolution |
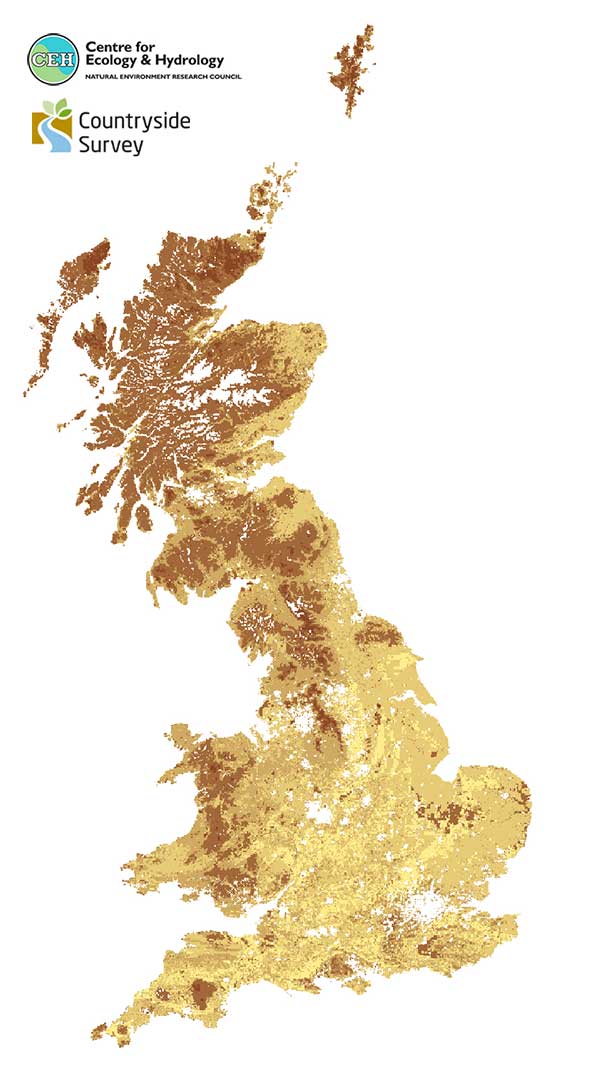
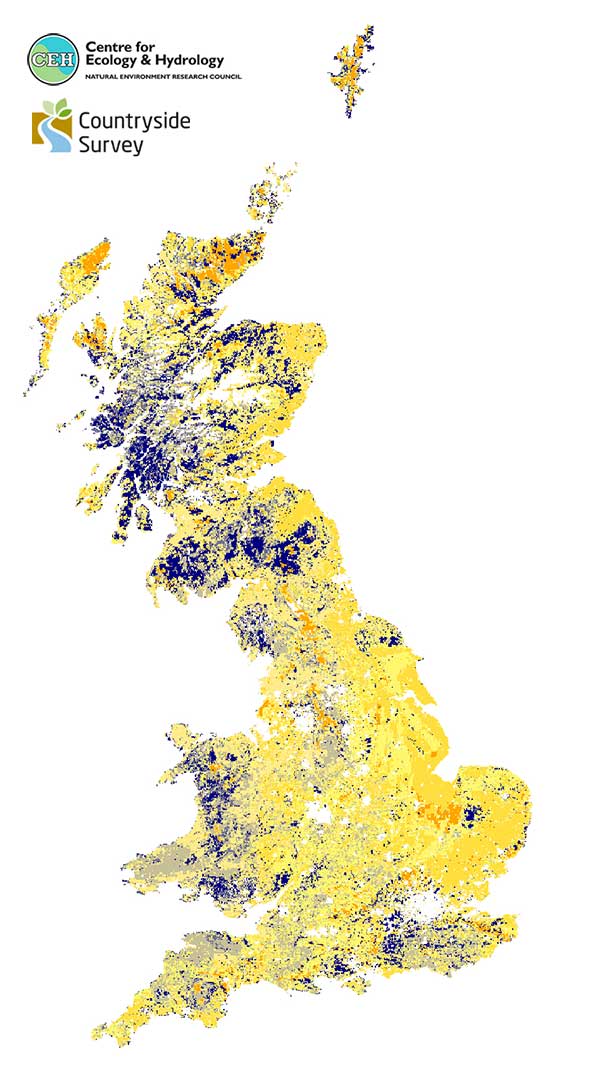
Countryside Survey (CS) topsoil carbon concentration (g kg-1) data is representative of 0–15cm soil depth. Carbon concentration was estimated by multiplying loss on ignition by a factor of 0.55. For topsoil carbon data data, a total of 2614 cores from 591 1km x 1km squares across Great Britain were collected and analysed in 2007.
The estimated means of combinations of broad habitat/dominant grain size class using 2007 data are mapped on to the dominant habitat and dominant grain size class in each 1km x 1km2 derived from the Land Cover Map 2007 and Parent Material Model 2009.
| Title | Countryside Survey - Topsoil carbon concentration |
|---|---|
| Source | Centre for Ecology & Hydrology |
| Enquiries | eidc@ceh.ac.uk |
| Scale(s) | 1km grid resolution |
| Coverage | Great Britain |
| Format | ArcGIS Shape file, MITAB, ArcInfo Interchange File, GML |
| Price | The data is free for access and use upon agreement of Terms & Conditions |
| Uses | Local to national level use |
| Map Viewer | View in UKSO Map Viewer |
| WMS link | https://catalogue.ceh.ac.uk/... |
| Images | High resolution | low resolution |
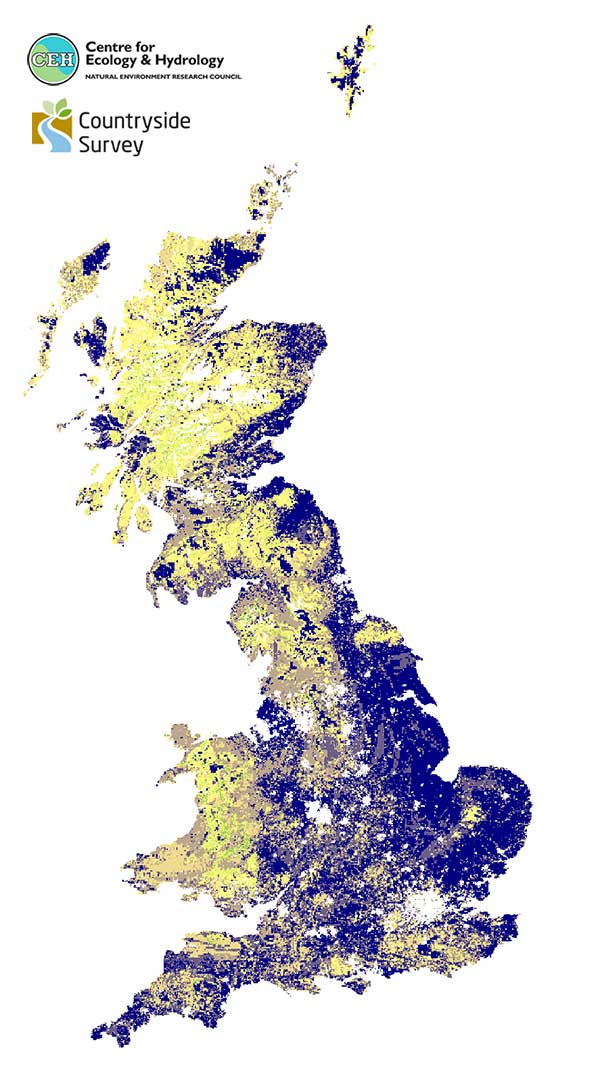
Countryside Survey (CS) topsoil carbon density (t ha-1) data is representative of 0–15cm soil depth. Carbon density was estimated by combining carbon concentration (g kg-1) with bulk density (g cm-3) estimates. For topsoil carbon data, a total of 2614 cores from 591 1km x 1km squares across Great Britain were collected and analysed in 2007.
The estimated means of combinations of broad habitat/calcium carbonate (CaCO3) rank using 2007 data are mapped on to the dominant habitat and CaCO3 rank in each 1km x 1km2 derived from the Land Cover Map 2007 and Parent Material Model 2009.

| Title | Countryside Survey - Topsoil carbon density |
|---|---|
| Source | Centre for Ecology & Hydrology |
| Enquiries | eidc@ceh.ac.uk |
| Scale(s) | 1km grid resolution |
| Coverage | Great Britain |
| Format | ArcGIS Shape file, MITAB, ArcInfo Interchange File, GML |
| Price | The data is free for access and use upon agreement of Terms & Conditions |
| Uses | Local to national level use |
| Map Viewer | View in UKSO Map Viewer |
| WMS link | https://catalogue.ceh.ac.uk/... |
| Images | High resolution | low resolution |
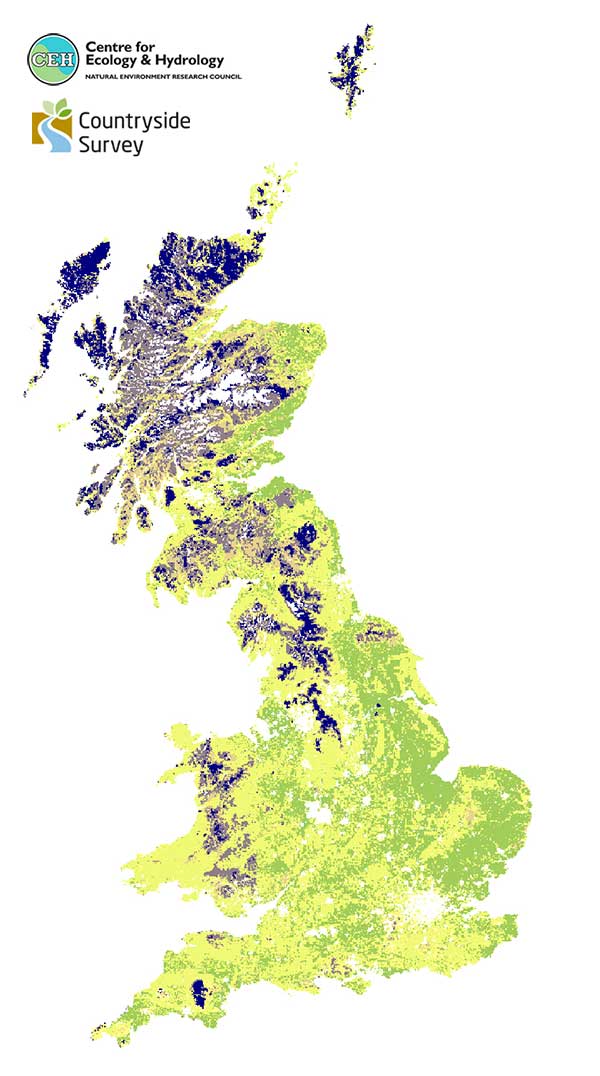
Countryside Survey (CS) topsoil C:N ratio data is representative of 0–15cm soil depth. For C:N ratio data, a total of 1024 cores from 256 1km x 1km squares across Great Britain were collected and analysed in 2007.
The estimated means of combinations of broad habitat/dominant grain size class using 2007 data are mapped on to the dominant habitat and dominant grain size class in each 1km x 1km2 derived from the Land Cover Map 2007 and Parent Material Model 2009.

| Title | Countryside Survey - Topsoil carbon to nitrogen ratio |
|---|---|
| Source | Centre for Ecology & Hydrology |
| Enquiries | eidc@ceh.ac.uk |
| Scale(s) | 1km grid resolution |
| Coverage | Great Britain |
| Format | ArcGIS Shape file, MITAB, ArcInfo Interchange File, GML |
| Price | The data is free for access and use upon agreement of Terms & Conditions |
| Uses | Local to national level use |
| Map Viewer | View in UKSO Map Viewer |
| WMS link | https://catalogue.ceh.ac.uk/... |
| Images | High resolution | low resolution |
Countryside Survey (CS) topsoil loss-on-ignition (LOI) data is representative of 0–15cm soil depth. LOI (%) was determined by combustion of 10g dry soil at 375°C for 16 hours. For topsoil carbon data, a total of 2614 cores from 591 1km x 1km squares across Great Britain were collected and analysed in 2007.
The estimated means of combinations of broad habitat/dominant grain size class using 2007 data are mapped on to the dominant habitat and dominant grain size class in each 1km x 1km2 derived from the Land Cover Map 2007 and Parent Material Model 2009.

| Title | Countryside Survey - Topsoil loss-on-ignition |
|---|---|
| Source | Centre for Ecology & Hydrology |
| Enquiries | eidc@ceh.ac.uk |
| Scale(s) | 1km grid resolution |
| Coverage | Great Britain |
| Format | ArcGIS Shape file, MITAB, ArcInfo Interchange File, GML |
| Price | The data is free for access and use upon agreement of Terms & Conditions |
| Uses | Local to national level use |
| Map Viewer | View in UKSO Map Viewer |
| WMS link | https://catalogue.ceh.ac.uk/... |
| Images | High resolution | low resolution |
Countryside Survey (CS) topsoil invertebrate Shannon diversity data is representative of 0–8cm soil depth. For topsoil invertebrate data, a total of 947 cores from 256 1km x 1km squares across Great Britain were collected and analysed in 2007.
The estimated means of combinations of broad habitat/soil group using 2007 data are mapped on to the dominant habitat and soil group in each 1km x 1km2 derived from the Land Cover Map 2007 and Parent Material Model 2009.
| Title | Countryside Survey - Topsoil invertebrates: Shannon diversity |
|---|---|
| Source | Centre for Ecology & Hydrology |
| Enquiries | eidc@ceh.ac.uk |
| Scale(s) | 1km grid resolution |
| Coverage | Great Britain |
| Format | ArcGIS Shape file, MITAB, ArcInfo Interchange File, GML |
| Price | The data is free for access and use upon agreement of Terms & Conditions |
| Uses | Local to national level use |
| Map Viewer | View in UKSO Map Viewer |
| WMS link | https://catalogue.ceh.ac.uk/... |
| Images | High resolution | low resolution |
Countryside Survey (CS) topsoil total invertebrate catch data is representative of 0–8cm soil depth. For topsoil invertebrate data, a total of 947 cores from 256 1km x 1km squares across Great Britain were collected and analysed in 2007.
The estimated means of combinations of broad habitat/dominant grain size class using 2007 data are mapped on to the dominant habitat and dominant grain size class in each 1km x 1km2 derived from the Land Cover Map 2007 and Parent Material Model 2009.
| Title | Countryside Survey - Topsoil invertebrates: Total catch |
|---|---|
| Source | Centre for Ecology & Hydrology |
| Enquiries | eidc@ceh.ac.uk |
| Scale(s) | 1km grid resolution |
| Coverage | Great Britain |
| Format | ArcGIS Shape file, MITAB, ArcInfo Interchange File, GML |
| Price | The data is free for access and use upon agreement of Terms & Conditions |
| Uses | Local to national level use |
| Map Viewer | View in UKSO Map Viewer |
| WMS link | https://catalogue.ceh.ac.uk/... |
| Images | High resolution | low resolution |
Countryside Survey (CS) topsoil Mite:Springtail ratio data is representative of 0–8cm soil depth. For topsoil invertebrate data, a total of 947 cores from 256 1km x 1km squares across Great Britain were collected and analysed in 2007.
The estimated means of combinations of broad habitat/dominant grain size class using 2007 data are mapped on to the dominant habitat and dominant grain size class in each 1km x 1km2 derived from the Land Cover Map 2007 and Parent Material Model 2009.
| Title | Countryside Survey - Topsoil invertebrates: Mite:Springtail ratio |
|---|---|
| Source | Centre for Ecology & Hydrology |
| Enquiries | eidc@ceh.ac.uk |
| Scale(s) | 1km grid resolution |
| Coverage | Great Britain |
| Format | ArcGIS Shape file, MITAB, ArcInfo Interchange File, GML |
| Price | The data is free for access and use upon agreement of Terms & Conditions |
| Uses | Local to national level use |
| Map Viewer | View in UKSO Map Viewer |
| WMS link | https://catalogue.ceh.ac.uk/... |
| Images | High resolution | low resolution |
Countryside Survey (CS) topsoil number of invertebrate broad taxa data is representative of 0–8cm soil depth. For topsoil invertebrate data, a total of 947 cores from 256 1km x 1km squares across Great Britain were collected and analysed in 2007.
The estimated means of combinations of broad habitat/dominant grain size class using 2007 data are mapped on to the dominant habitat and dominant grain size class in each 1km x 1km2 derived from the Land Cover Map 2007 and Parent Material Model 2009.
| Title | Countryside Survey - Topsoil invertebrates: Number of broad taxa |
|---|---|
| Source | Centre for Ecology & Hydrology |
| Enquiries | eidc@ceh.ac.uk |
| Scale(s) | 1km grid resolution |
| Coverage | Great Britain |
| Format | ArcGIS Shape file, MITAB, ArcInfo Interchange File, GML |
| Price | The data is free for access and use upon agreement of Terms & Conditions |
| Uses | Local to national level use |
| Map Viewer | View in UKSO Map Viewer |
| WMS link | https://catalogue.ceh.ac.uk/... |
| Images | High resolution | low resolution |
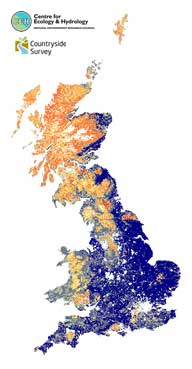
Countryside Survey (CS) topsoil Olsen-Phosphorus (mg kg-1) data is representative of 0–15cm soil depth. For Olsen-P data, a total of 1054 cores from 256 1km x 1km squares across Great Britain were collected and analysed in 2007.
The estimated means of combinations of broad habitat/dominant grain size class using 2007 data are mapped on to the dominant habitat and dominant grain size class in each 1km x 1km2 derived from the Land Cover Map 2007 and Parent Material Model 2009.
| Title | Countryside Survey - Topsoil Olsen-Phosphorus |
|---|---|
| Source | Centre for Ecology & Hydrology |
| Enquiries | eidc@ceh.ac.uk |
| Scale(s) | 1km grid resolution |
| Coverage | Great Britain |
| Format | ArcGIS Shape file, MITAB, ArcInfo Interchange File, GML |
| Price | The data is free for access and use upon agreement of Terms & Conditions |
| Uses | Local to national level use |
| Map Viewer | View in UKSO Map Viewer |
| WMS link | https://catalogue.ceh.ac.uk/... |
| Images | High resolution | low resolution |
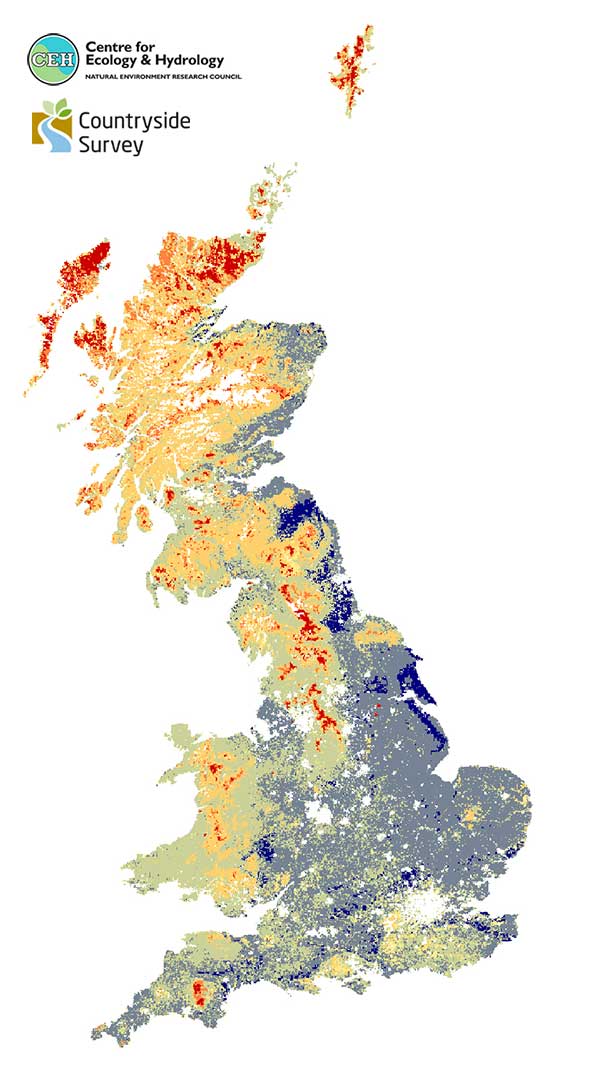
Countryside Survey (CS) topsoil pH data is representative of 0–15cm soil depth. Topsoil pH was measured using 10g of field moist soil with 25ml de-ionised water giving a ratio of soil to water of 1:2.5 by weight. For topsoil bulk density data, a total of 2614 cores from 591 1km x 1km squares across Great Britain were collected and analysed in 2007.
The estimated means of combinations of broad habitat/calcium carbonate (CaCO3) rank using 2007 data are mapped on to the dominant habitat and CaCO3 rank in each 1km x 1km2 derived from the Land Cover Map 2007 and Parent Material Model 2009.

| Title | Countryside Survey - Topsoil pH |
|---|---|
| Source | Centre for Ecology & Hydrology |
| Enquiries | eidc@ceh.ac.uk |
| Scale(s) | 1km grid resolution |
| Coverage | Great Britain |
| Format | ArcGIS Shape file, MITAB, ArcInfo Interchange File, GML |
| Price | The data is free for access and use upon agreement of Terms & Conditions |
| Uses | Local to national level use |
| Map Viewer | View in UKSO Map Viewer |
| WMS link | https://catalogue.ceh.ac.uk/... |
| Images | High resolution | low resolution |
Countryside Survey (CS) topsoil total nitrogen (N) concentration (%) data is representative of 0–15cm soil depth. For topsoil total N concentration data, a total of 1024 cores from 256 1km x 1km squares across Great Britain were collected and analysed in 2007.
The estimated means of combinations of broad habitat/dominant grain size class using 2007 data are mapped on to the dominant habitat and dominant grain size class in each 1km x 1km2 derived from the Land Cover Map 2007 and Parent Material Model 2009.
| Title | Countryside Survey - Topsoil total nitrogen concentration |
|---|---|
| Source | Centre for Ecology & Hydrology |
| Enquiries | eidc@ceh.ac.uk |
| Scale(s) | 1km grid resolution |
| Coverage | Great Britain |
| Format | ArcGIS Shape file, MITAB, ArcInfo Interchange File, GML |
| Price | The data is free for access and use upon agreement of Terms & Conditions |
| Uses | Local to national level use |
| Map Viewer | View in UKSO Map Viewer |
| WMS link | https://catalogue.ceh.ac.uk/... |
| Images | High resolution | low resolution |
Countryside Survey (CS) topsoil moisture (%) data is representative of 0–15cm soil depth. Gravimetric soil moisture was estimated by making detailed weight measurements throughout the soil processing procedure. For topsoil bulk density data, a total of 2614 cores from 591 1km x 1km squares across Great Britain were collected and analysed in 2007.
The estimated means of combinations of broad habitat/both dominant grain size class and calcium carbonate content using 2007 data are mapped on to the dominant habitat and dominant grain size class in each 1km x 1km2 derived from the Land Cover Map 2007 and Parent Material Model 2009.
| Title | Countryside Survey - Topsoil moisture |
|---|---|
| Source | Centre for Ecology & Hydrology |
| Enquiries | eidc@ceh.ac.uk |
| Scale(s) | 1km grid resolution |
| Coverage | Great Britain |
| Format | ArcGIS Shape file, MITAB, ArcInfo Interchange File, GML |
| Price | The data is free for access and use upon agreement of Terms & Conditions |
| Uses | Local to national level use |
| Map Viewer | View in UKSO Map Viewer |
| WMS link | https://catalogue.ceh.ac.uk/... |
| Images | High resolution | low resolution |
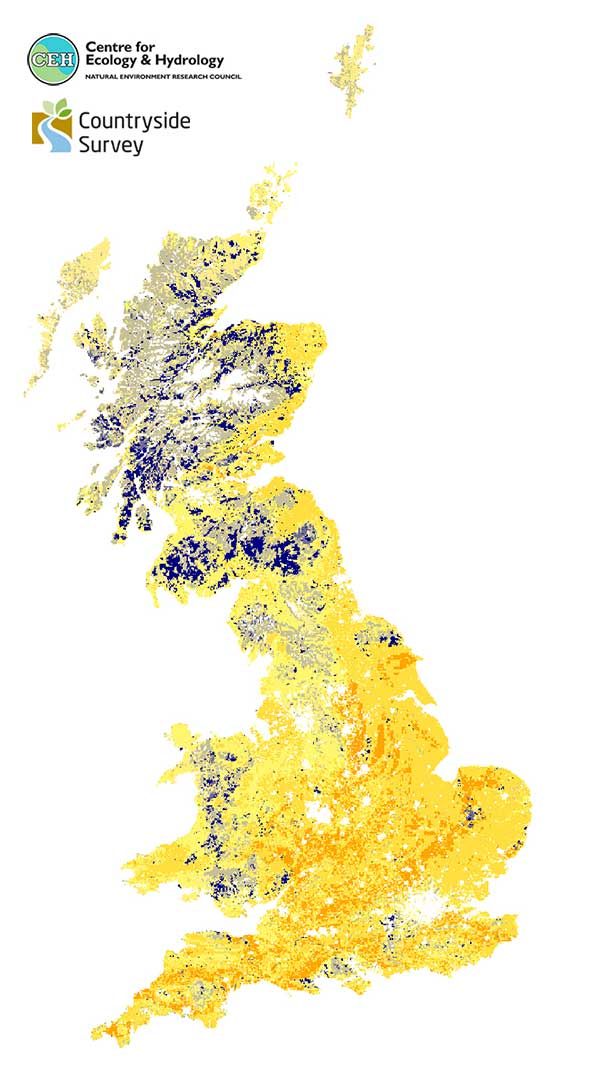
Countryside Survey (CS) topsoil microbes data is representative of 0–15cm soil depth. Soils were collected from over 1000 plots within 233 1km x 1km squares across Great Britain were collected and analysed in 2007. Bacterial communities were assessed using a molecular community profiling tool (tRFLP) with bacterial community structure represented using scores from the first axis of an ordination of the data.
The estimated means of combinations of broad habitat/calcium carbonate (CaCO3) using 2007 data are mapped on to the dominant habitat and CaCO3 content in each 1km x 1km2 derived from the Land Cover Map 2007 and Parent Material Model 2009.
This is the dataset used in our paper publishing the results of this survey.
Griffiths, R I, Thomson, B C, James, P, Bell, T, Bailey, M, Whiteley, A S. 2011. The bacterial biogeography of British soils. Environmental Microbiology, 13 (6). 1642-1654. 10.1111/j.1462-2920.2011.02480.x

| Title | Countryside Survey - Topsoil Microbes: Bacterial community |
|---|---|
| Source | Centre for Ecology & Hydrology |
| Enquiries | eidc@ceh.ac.uk |
| Scale(s) | 1km grid resolution |
| Coverage | Great Britain |
| Format | ArcGIS Shape file, MITAB, ArcInfo Interchange File, GML |
| Price | The data is free for access and use upon agreement of Terms & Conditions |
| Uses | Local to national level use |
| Map Viewer | View in UKSO Map Viewer |
| WMS link | https://catalogue.ceh.ac.uk/... |
| Images | High resolution | low resolution |
Countryside Survey (CS) topsoil microbes data is representative of 0–15cm soil depth. Soils were collected from over 1000 plots within 233 1km x 1km squares across Great Britain were collected and analysed in 2007. Bacterial communities were assessed using a molecular community profiling tool (tRFLP) with Shannon diversity index calculated using using the relative abundance of each tRFLP peak within each sample.
The estimated means of combinations of broad habitat/calcium carbonate (CaCO3) using 2007 data are mapped on to the dominant habitat and CaCO3 content in each 1km x 1km2 derived from the Land Cover Map 2007 and Parent Material Model 2009.
This is the dataset used in our paper publishing the results of this survey.
Griffiths, R I, Thomson, B C, James, P, Bell, T, Bailey, M, Whiteley, A S. 2011. The bacterial biogeography of British soils. Environmental Microbiology, 13 (6). 1642-1654. 10.1111/j.1462-2920.2011.02480.x
| Title | Countryside Survey - Topsoil Microbes: Bacterial Shannon diversity |
|---|---|
| Source | Centre for Ecology & Hydrology |
| Enquiries | eidc@ceh.ac.uk |
| Scale(s) | 1km grid resolution |
| Coverage | Great Britain |
| Format | ArcGIS Shape file, MITAB, ArcInfo Interchange File, GML |
| Price | The data is free for access and use upon agreement of Terms & Conditions |
| Uses | Local to national level use |
| Map Viewer | View in UKSO Map Viewer |
| WMS link | https://catalogue.ceh.ac.uk/... |
| Images | High resolution | low resolution |
Countryside Survey (CS) topsoil microbes data is representative of 0–15cm soil depth. Soils were collected from over 1000 plots within 233 1km x 1km squares across Great Britain were collected and analysed in 2007. Bacterial communities were assessed using a molecular community profiling tool (tRFLP) with Shannon diversity index calculated using using the relative abundance of each tRFLP peak within each sample.
The estimated means of combinations of broad habitat/calcium carbonate (CaCO3) using 2007 data are mapped on to the dominant habitat and CaCO3 content in each 1km x 1km2 derived from the Land Cover Map 2007 and Parent Material Model 2009.
This is the dataset used in our paper publishing the results of this survey.
Griffiths, R I, Thomson, B C, James, P, Bell, T, Bailey, M, Whiteley, A S. 2011. The bacterial biogeography of British soils. Environmental Microbiology, 13 (6). 1642-1654. 10.1111/j.1462-2920.2011.02480.x

| Title | Countryside Survey - Topsoil Microbes: Bacterial Simpson diversity |
|---|---|
| Source | Centre for Ecology & Hydrology |
| Enquiries | eidc@ceh.ac.uk |
| Scale(s) | 1km grid resolution |
| Coverage | Great Britain |
| Format | ArcGIS Shape file, MITAB, ArcInfo Interchange File, GML |
| Price | The data is free for access and use upon agreement of Terms & Conditions |
| Uses | Local to national level use |
| Map Viewer | View in UKSO Map Viewer |
| WMS link | https://catalogue.ceh.ac.uk/... |
| Images | High resolution | low resolution |