Select an option from the list below to view high resolution images and data about soil element concentrations across England and Wales.
The Advanced Soil Geochemical Atlas of England and Wales was a joint project between the British Geological Survey (BGS) and Rothamsted Research, and is based on soil samples collected for the National Soil Inventory (NSI) by the Soil Survey of England and Wales (now the National Soil Resources Institute, Cranfield University). The maps are based on 5700 surface soil samples (0–15 cm), collected across England and Wales, that have been analysed for 50 major and trace elements (eg aluminium, calcium, rubidium, lanthanum, selenium etc). The compiled atlas is also available online for viewing as an ebook download. The data for each of the elements can be downloaded as a set of interpolated concentrations (20Mb) on a 1 kilometre grid across England and Wales.
These data are delivered under the terms of the Open Government Licence, subject to the following acknowledgement accompanying the reproduced BGS materials: "Contains British Geological Survey materials © UKRI [year]".
The maps cover England and Wales showing interpolated values of topsoil element concentrations (mg/kg) at a 1km grid resolution.
The concentrations of aluminium were determined using wavelength dispersive X-ray fluorescence spectrometry with a lower limit of detection of 0.05 % and typical coefficients of variation of around 3% for repeated analyses of certified reference materials. The coefficient of variation (CV) expresses the error associated with subsampling and analysis; CV values of less than around 10 % suggest that analyses are reasonably accurate.
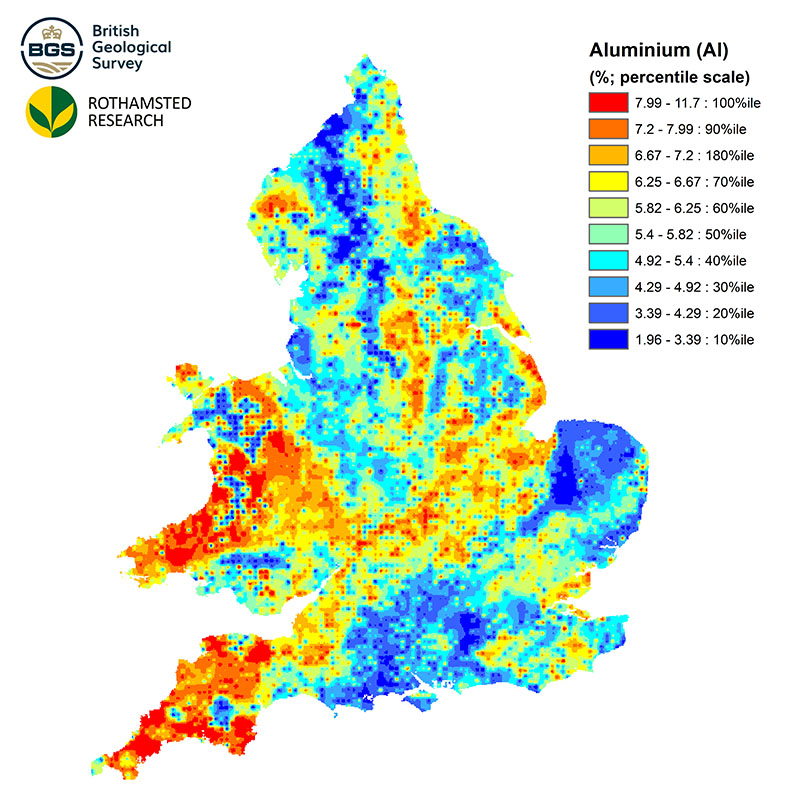
| Title | NSI Topsoil Aluminium Concentrations |
|---|---|
| Source | British Geological Survey |
| Enquiries | enquiries@bgs.ac.uk |
| Scale(s) | 1km grid resolution |
| Coverage | England and Wales |
| Format | ESRI grid data (others available by request) |
| Price | The 1 km grid data is free for use under Open Government Licence terms |
| Uses | Local to national level use |
| Map Viewer | View in UKSO Map Viewer |
| WMS link | https://map.bgs.ac.uk/... |
| Images | High resolution | low resolution |
| Additional Media | 1km grid data |
The concentrations of antimony were determined using energy dispersive X-ray fluorescence spectrometry with a lower limit of detection of 0.25 mg/kg and typical coefficients of variation of around 8% for repeated analyses of certified reference materials. The coefficient of variation (CV) expresses the error associated with subsampling and analysis; CV values of less than around 10 % suggest that analyses are reasonably accurate.

| Title | NSI Topsoil Antimony Concentrations |
|---|---|
| Source | British Geological Survey |
| Enquiries | enquiries@bgs.ac.uk |
| Scale(s) | 1km grid resolution |
| Coverage | England and Wales |
| Format | ESRI grid data (others available by request) |
| Price | The 1 km grid data is free for use under Open Government Licence terms |
| Uses | Local to national level use |
| Map Viewer | View in UKSO Map Viewer |
| WMS link | https://map.bgs.ac.uk/... |
| Images | High resolution | low resolution |
| Additional Media | 1km grid data |
The concentrations of arsenic were determined using wavelength dispersive X-ray fluorescence spectrometry with a lower limit of detection of 2.4 mg/kg and typical coefficients of variation of around 5 % for repeated analyses of certified reference materials. The coefficient of variation (CV) expresses the error associated with subsampling and analysis; CV values of less than around 10 % suggest that analyses are reasonably accurate.

| Title | NSI Topsoil Arsenic Concentrations |
|---|---|
| Source | British Geological Survey |
| Enquiries | enquiries@bgs.ac.uk |
| Scale(s) | 1km grid resolution |
| Coverage | England and Wales |
| Format | ESRI grid data (others available by request) |
| Price | The 1 km grid data is free for use under Open Government Licence terms |
| Uses | Local to national level use |
| Map Viewer | View in UKSO Map Viewer |
| WMS link | https://map.bgs.ac.uk/... |
| Images | High resolution | low resolution |
| Additional Media | 1km grid data |
The concentrations of barium were determined using energy dispersive X-ray fluorescence spectrometry with a lower limit of detection of 0.25 mg/kg and typical coefficients of variation of around 8% for repeated analyses of certified reference materials. The coefficient of variation (CV) expresses the error associated with subsampling and analysis; CV values of less than around 10 % suggest that analyses are reasonably accurate.

| Title | NSI Topsoil Barium Concentrations |
|---|---|
| Source | British Geological Survey |
| Enquiries | enquiries@bgs.ac.uk |
| Scale(s) | 1km grid resolution |
| Coverage | England and Wales |
| Format | ESRI grid data (others available by request) |
| Price | The 1 km grid data is free for use under Open Government Licence terms |
| Uses | Local to national level use |
| Map Viewer | View in UKSO Map Viewer |
| WMS link | https://map.bgs.ac.uk/... |
| Images | High resolution | low resolution |
| Additional Media | 1km grid data |
The concentrations of bismuth were determined using energy dispersive X-ray fluorescence spectrometry with a lower limit of detection of 0.6 mg/kg and typical coefficients of variation of around 40 % for repeated analyses of certified reference materials. The coefficient of variation (CV) expresses the error associated with subsampling and analysis; CV values of less than around 10 % suggest that analyses are reasonably accurate.
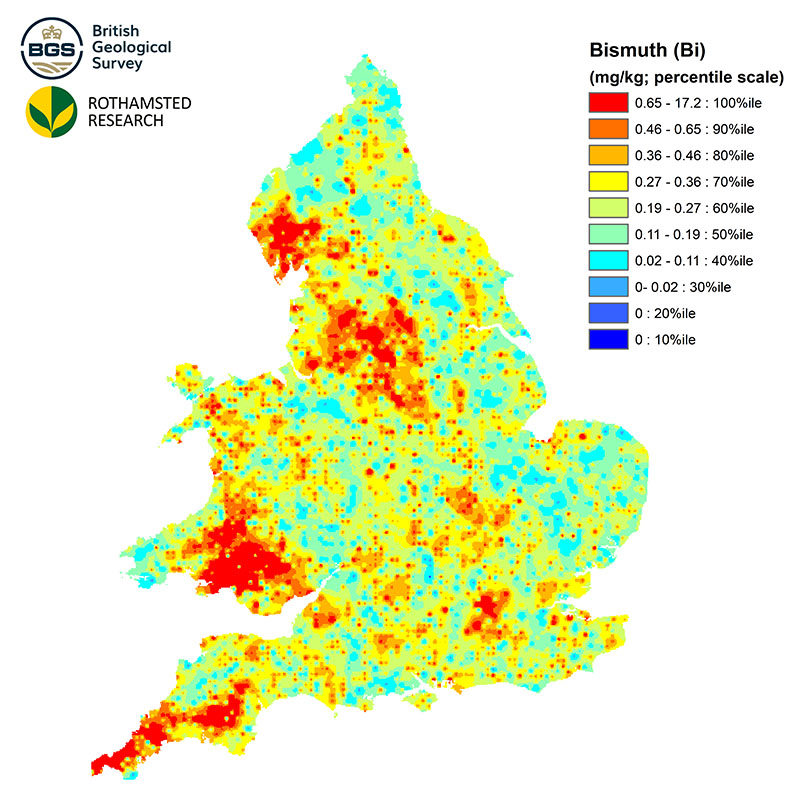
| Title | NSI Topsoil Bismuth Concentrations |
|---|---|
| Source | British Geological Survey |
| Enquiries | enquiries@bgs.ac.uk |
| Scale(s) | 1km grid resolution |
| Coverage | England and Wales |
| Format | ESRI grid data (others available by request) |
| Price | The 1 km grid data is free for use under Open Government Licence terms |
| Uses | Local to national level use |
| Map Viewer | View in UKSO Map Viewer |
| WMS link | https://map.bgs.ac.uk/... |
| Images | High resolution | low resolution |
| Additional Media | 1km grid data |
The concentrations of bromine were determined using wavelength dispersive X-ray fluorescence spectrometry with a lower limit of detection of 0.7 mg/kg and typical coefficients of variation of around 6 % for repeated analyses of certified reference materials. The coefficient of variation (CV) expresses the error associated with subsampling and analysis; CV values of less than around 10 % suggest that analyses are reasonably accurate.
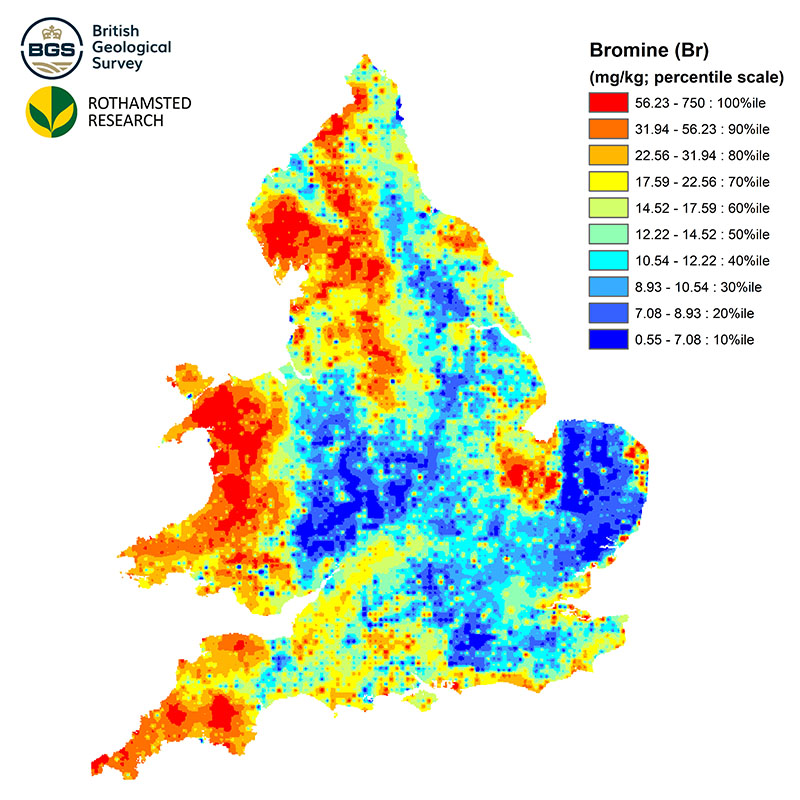
| Title | NSI Topsoil Bromine Concentrations |
|---|---|
| Source | British Geological Survey |
| Enquiries | enquiries@bgs.ac.uk |
| Scale(s) | 1km grid resolution |
| Coverage | England and Wales |
| Format | ESRI grid data (others available by request) |
| Price | The 1 km grid data is free for use under Open Government Licence terms |
| Uses | Local to national level use |
| Map Viewer | View in UKSO Map Viewer |
| WMS link | https://map.bgs.ac.uk/... |
| Images | High resolution | low resolution |
| Additional Media | 1km grid data |
The concentrations of cadmium were determined using energy dispersive X-ray fluorescence spectrometry with a lower limit of detection of 0.25 mg/kg and typical coefficients of variation of around 6 % for repeated analyses of certified reference materials. The coefficient of variation (CV) expresses the error associated with subsampling and analysis; CV values of less than around 10 % suggest that analyses are reasonably accurate.
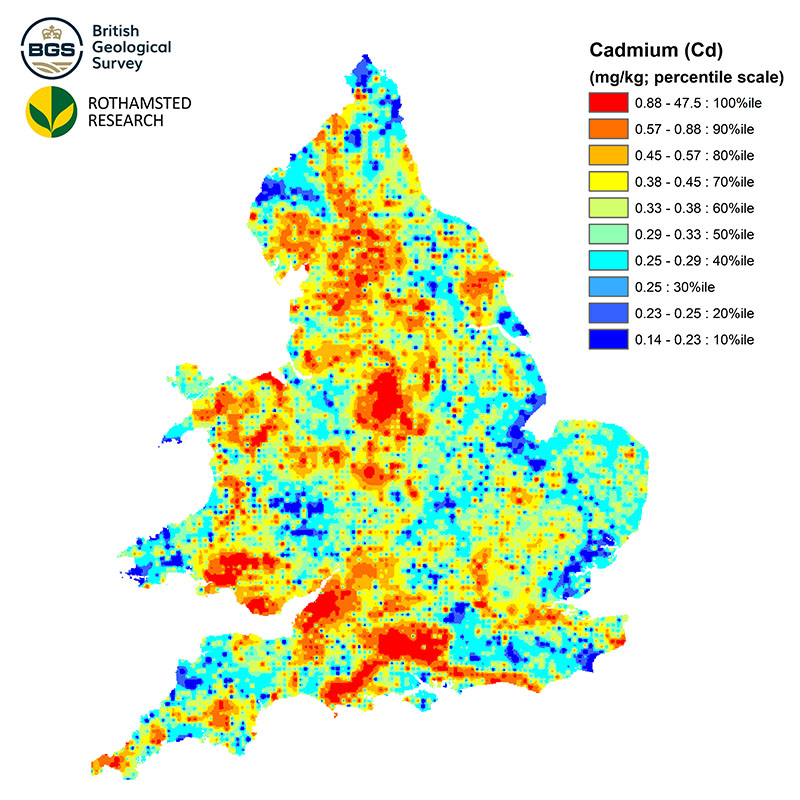
| Title | NSI Topsoil Cadmium Concentrations |
|---|---|
| Source | British Geological Survey |
| Enquiries | enquiries@bgs.ac.uk |
| Scale(s) | 1km grid resolution |
| Coverage | England and Wales |
| Format | ESRI grid data (others available by request) |
| Price | The 1 km grid data is free for use under Open Government Licence terms |
| Uses | Local to national level use |
| Map Viewer | View in UKSO Map Viewer |
| WMS link | https://map.bgs.ac.uk/... |
| Images | High resolution | low resolution |
| Additional Media | 1km grid data |
The concentrations of caesium were determined using energy dispersive X-ray fluorescence spectrometry with a lower limit of detection of 0.5 mg/kg and typical coefficients of variation of around 10 % for repeated analyses of certified reference materials. The coefficient of variation (CV) expresses the error associated with subsampling and analysis; CV values of less than around 10 % suggest that analyses are reasonably accurate.
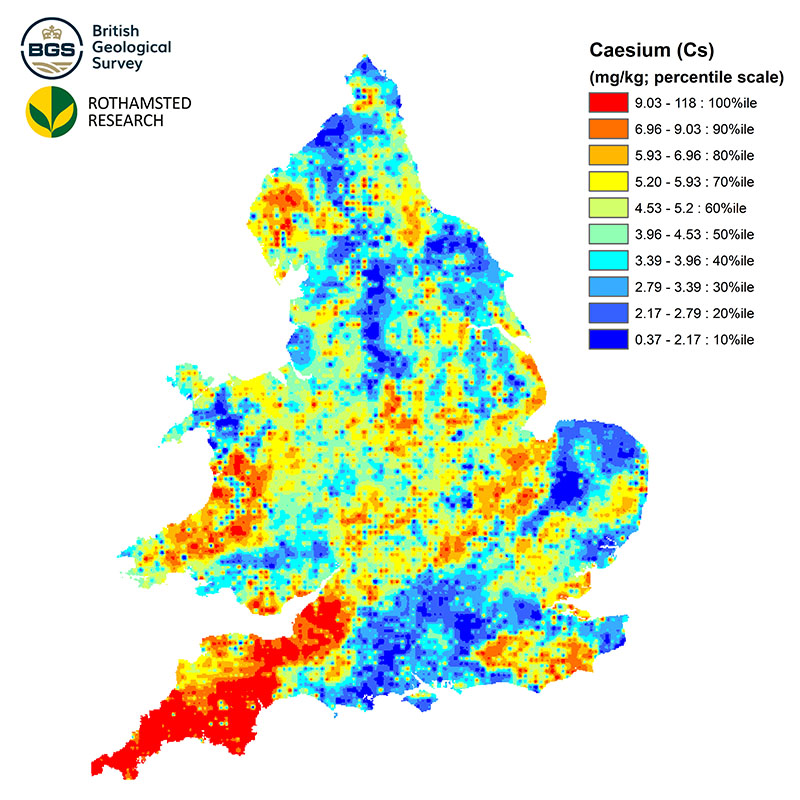
| Title | NSI Topsoil Caesium Concentrations |
|---|---|
| Source | British Geological Survey |
| Enquiries | enquiries@bgs.ac.uk |
| Scale(s) | 1km grid resolution |
| Coverage | England and Wales |
| Format | ESRI grid data (others available by request) |
| Price | The 1 km grid data is free for use under Open Government Licence terms |
| Uses | Local to national level use |
| Map Viewer | View in UKSO Map Viewer |
| WMS link | https://map.bgs.ac.uk/... |
| Images | High resolution | low resolution |
| Additional Media | 1km grid data |
The concentrations of calcium were determined using wavelength dispersive X-ray fluorescence spectrometry with a lower limit of detection of 0.025 % and typical coefficients of variation of around 2% for repeated analyses of certified reference materials. The coefficient of variation (CV) expresses the error associated with subsampling and analysis; CV values of less than around 10 % suggest that analyses are reasonably accurate.
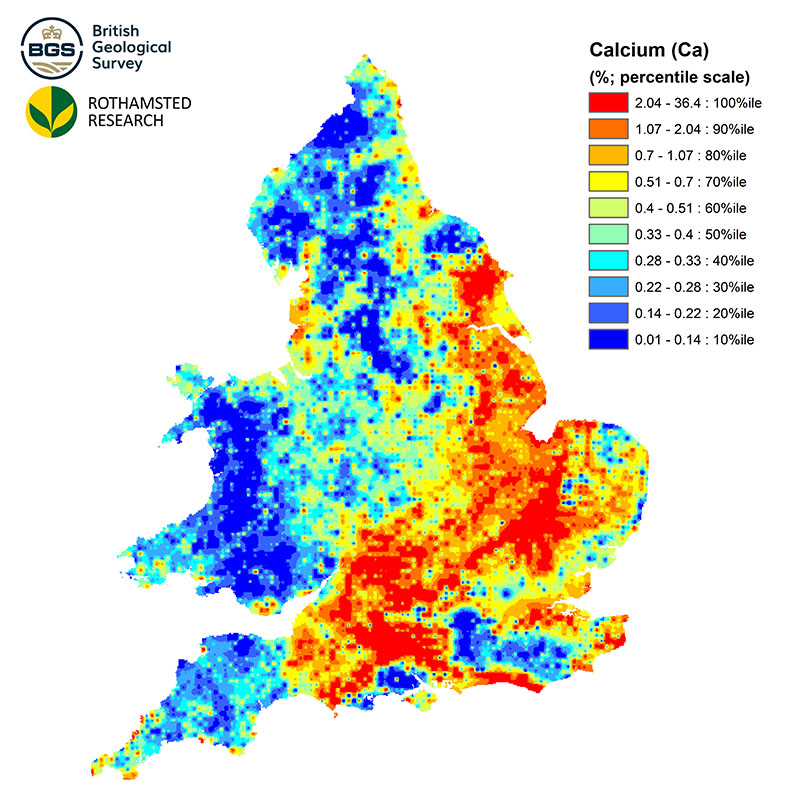
| Title | NSI Topsoil Calcium Concentrations |
|---|---|
| Source | British Geological Survey |
| Enquiries | enquiries@bgs.ac.uk |
| Scale(s) | 1km grid resolution |
| Coverage | England and Wales |
| Format | ESRI grid data (others available by request) |
| Price | The 1 km grid data is free for use under Open Government Licence terms |
| Uses | Local to national level use |
| Map Viewer | View in UKSO Map Viewer |
| WMS link | https://map.bgs.ac.uk/... |
| Images | High resolution | low resolution |
| Additional Media | 1km grid data |
The concentrations of cerium were determined using wavelength dispersive X-ray fluorescence spectrometry with a lower limit of detection of 0.6 mg/kg and typical coefficients of variation of around 2 % for repeated analyses of certified reference materials. The coefficient of variation (CV) expresses the error associated with subsampling and analysis; CV values of less than around 10 % suggest that analyses are reasonably accurate.
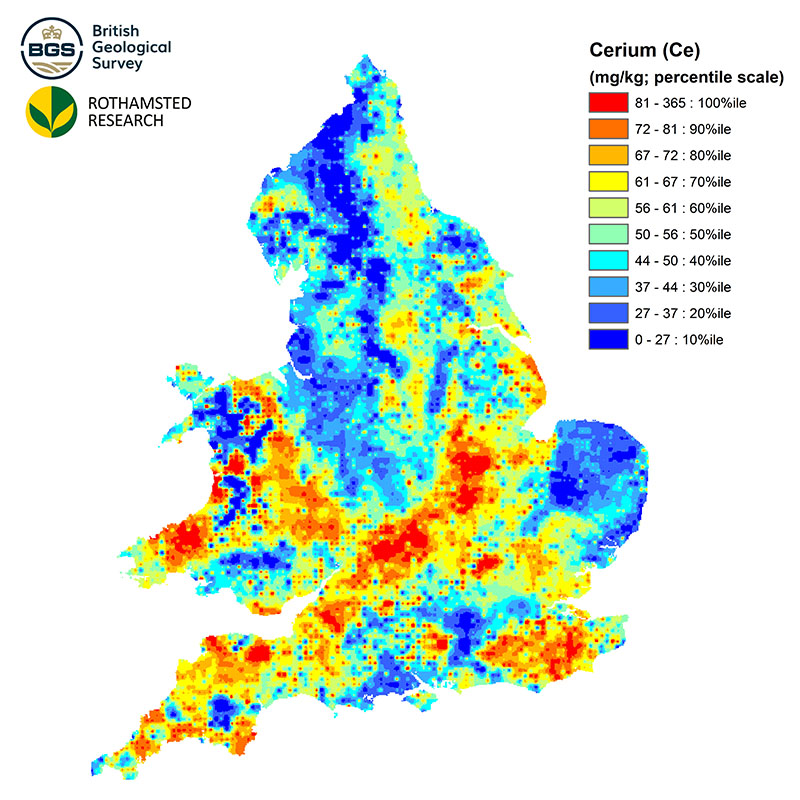
| Title | NSI Topsoil Cerium Concentrations |
|---|---|
| Source | British Geological Survey |
| Enquiries | enquiries@bgs.ac.uk |
| Scale(s) | 1km grid resolution |
| Coverage | England and Wales |
| Format | ESRI grid data (others available by request) |
| Price | The 1 km grid data is free for use under Open Government Licence terms |
| Uses | Local to national level use |
| Map Viewer | View in UKSO Map Viewer |
| WMS link | https://map.bgs.ac.uk/... |
| Images | High resolution | low resolution |
| Additional Media | 1km grid data |
The concentrations of chlorine were determined using wavelength dispersive X-ray fluorescence spectrometry; we cannot provide a lower limit of detection of or coefficient of variation for this element.
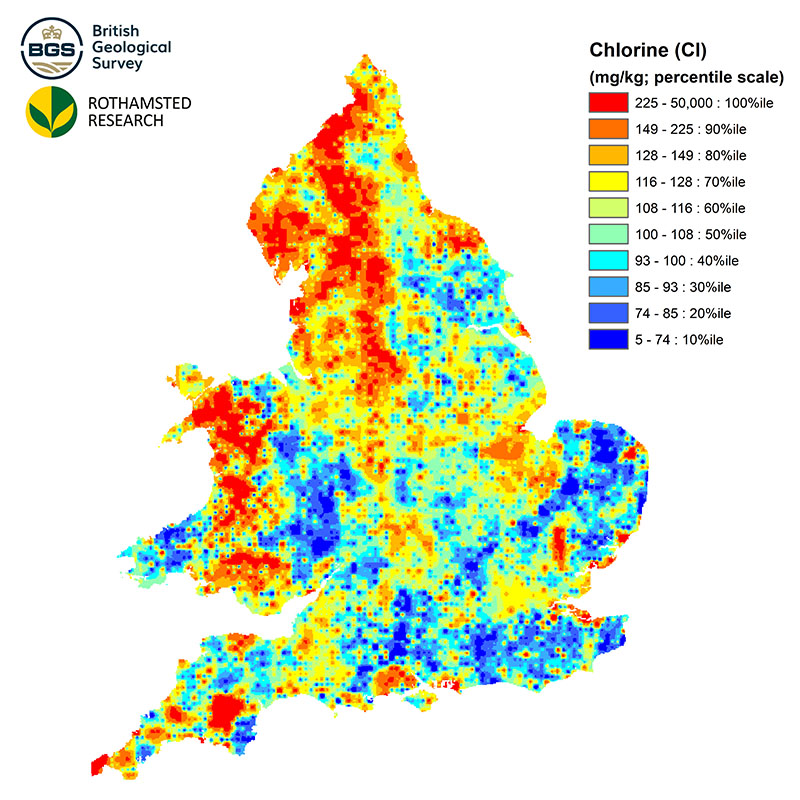
| Title | NSI Topsoil Chlorine Concentrations |
|---|---|
| Source | British Geological Survey |
| Enquiries | enquiries@bgs.ac.uk |
| Scale(s) | 1km grid resolution |
| Coverage | England and Wales |
| Format | ESRI grid data (others available by request) |
| Price | The 1 km grid data is free for use under Open Government Licence terms |
| Uses | Local to national level use |
| Map Viewer | View in UKSO Map Viewer |
| WMS link | https://map.bgs.ac.uk/... |
| Images | High resolution | low resolution |
| Additional Media | 1km grid data |
The concentrations of chromium were determined using energy dispersive X-ray fluorescence spectrometry with a lower limit of detection of 0.25 mg/kg and typical coefficients of variation of around 8% for repeated analyses of certified reference materials. The coefficient of variation (CV) expresses the error associated with subsampling and analysis; CV values of less than around 10 % suggest that analyses are reasonably accurate.
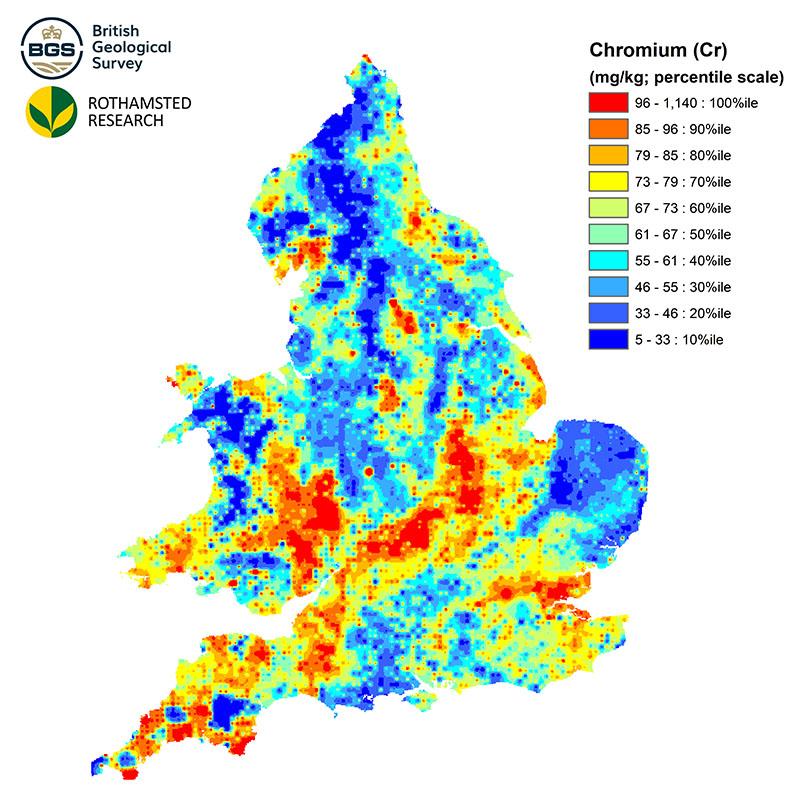
| Title | NSI Topsoil Chromium Concentrations |
|---|---|
| Source | British Geological Survey |
| Enquiries | enquiries@bgs.ac.uk |
| Scale(s) | 1km grid resolution |
| Coverage | England and Wales |
| Format | ESRI grid data (others available by request) |
| Price | The 1 km grid data is free for use under Open Government Licence terms |
| Uses | Local to national level use |
| Map Viewer | View in UKSO Map Viewer |
| WMS link | https://map.bgs.ac.uk/... |
| Images | High resolution | low resolution |
| Additional Media | 1km grid data |
The concentrations of cobalt were determined using wavelength dispersive X-ray fluorescence spectrometry with a lower limit of detection of 1.5 mg/kg and typical coefficients of variation of around 8 % for repeated analyses of certified reference materials. The coefficient of variation (CV) expresses the error associated with subsampling and analysis; CV values of less than around 10 % suggest that analyses are reasonably accurate.
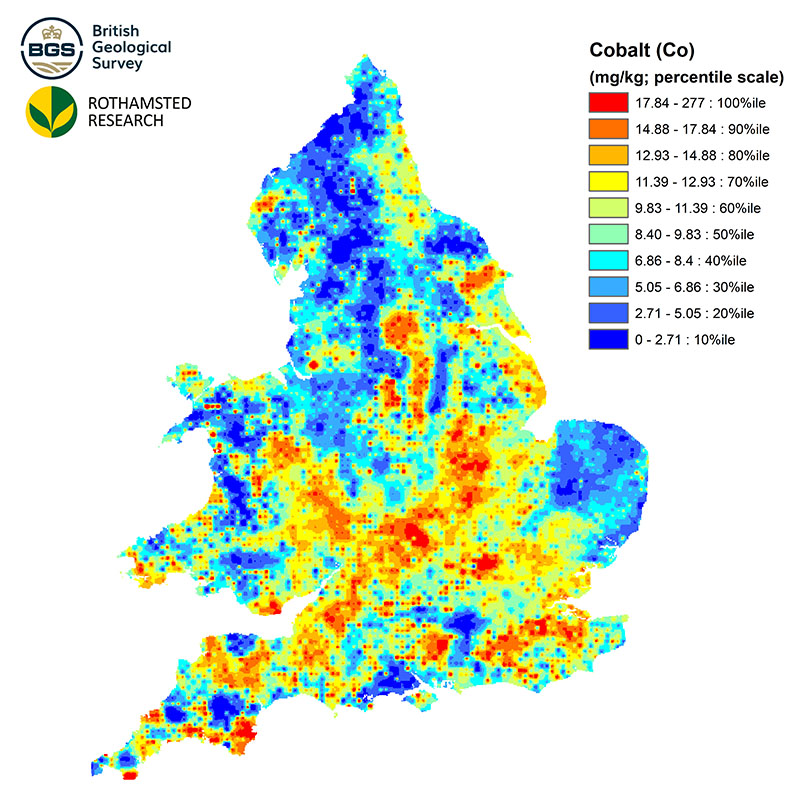
| Title | NSI Topsoil Cobalt Concentrations |
|---|---|
| Source | British Geological Survey |
| Enquiries | enquiries@bgs.ac.uk |
| Scale(s) | 1km grid resolution |
| Coverage | England and Wales |
| Format | ESRI grid data (others available by request) |
| Price | The 1 km grid data is free for use under Open Government Licence terms |
| Uses | Local to national level use |
| Map Viewer | View in UKSO Map Viewer |
| WMS link | https://map.bgs.ac.uk/... |
| Images | High resolution | low resolution |
| Additional Media | 1km grid data |
The concentrations of copper were determined using wavelength dispersive X-ray fluorescence spectrometry with a lower limit of detection of 1.2 mg/kg and typical coefficients of variation of around 3 % for repeated analyses of certified reference materials. The coefficient of variation (CV) expresses the error associated with subsampling and analysis; CV values of less than around 10 % suggest that analyses are reasonably accurate.
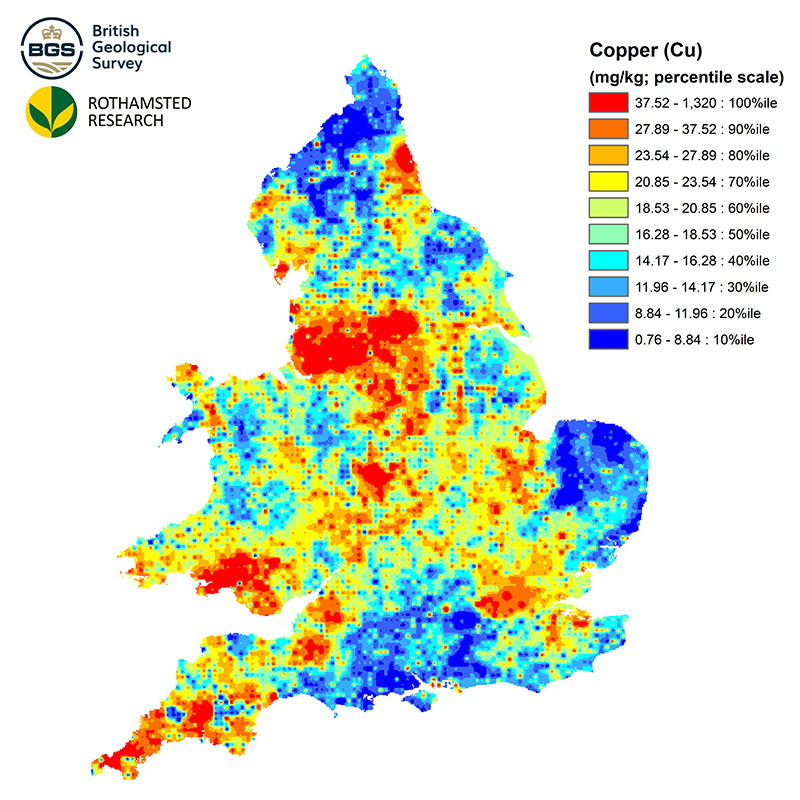
| Title | NSI Topsoil Copper Concentrations |
|---|---|
| Source | British Geological Survey |
| Enquiries | enquiries@bgs.ac.uk |
| Scale(s) | 1km grid resolution |
| Coverage | England and Wales |
| Format | ESRI grid data (others available by request) |
| Price | The 1 km grid data is free for use under Open Government Licence terms |
| Uses | Local to national level use |
| Map Viewer | View in UKSO Map Viewer |
| WMS link | https://map.bgs.ac.uk/... |
| Images | High resolution | low resolution |
| Additional Media | 1km grid data |
The concentrations of gallium were determined using wavelength dispersive X-ray fluorescence spectrometry with a lower limit of detection of 1 mg/kg and typical coefficients of variation of around 4 % for repeated analyses of certified reference materials. The coefficient of variation (CV) expresses the error associated with subsampling and analysis; CV values of less than around 10 % suggest that analyses are reasonably accurate.
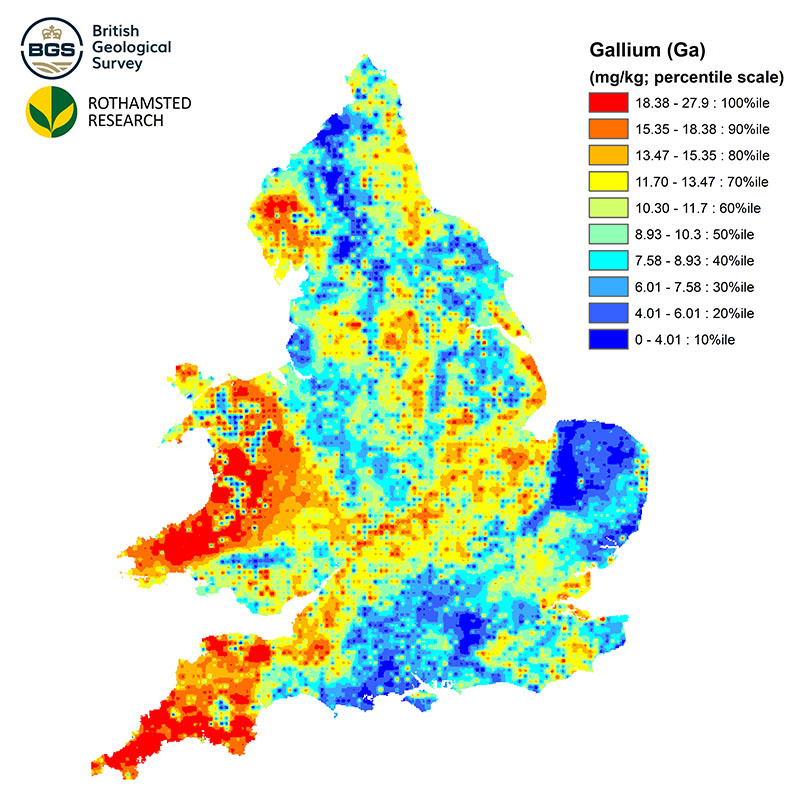
| Title | NSI Topsoil Gallium Concentrations |
|---|---|
| Source | British Geological Survey |
| Enquiries | enquiries@bgs.ac.uk |
| Scale(s) | 1km grid resolution |
| Coverage | England and Wales |
| Format | ESRI grid data (others available by request) |
| Price | The 1 km grid data is free for use under Open Government Licence terms |
| Uses | Local to national level use |
| Map Viewer | View in UKSO Map Viewer |
| WMS link | https://map.bgs.ac.uk/... |
| Images | High resolution | low resolution |
| Additional Media | 1km grid data |
The concentrations of germanium were determined using wavelength dispersive X-ray fluorescence spectrometry with a lower limit of detection of 0.5 mg/kg and typical coefficients of variation of around 33 % for repeated analyses of certified reference materials. The coefficient of variation (CV) expresses the error associated with subsampling and analysis; CV values of less than around 10 % suggest that analyses are reasonably accurate.
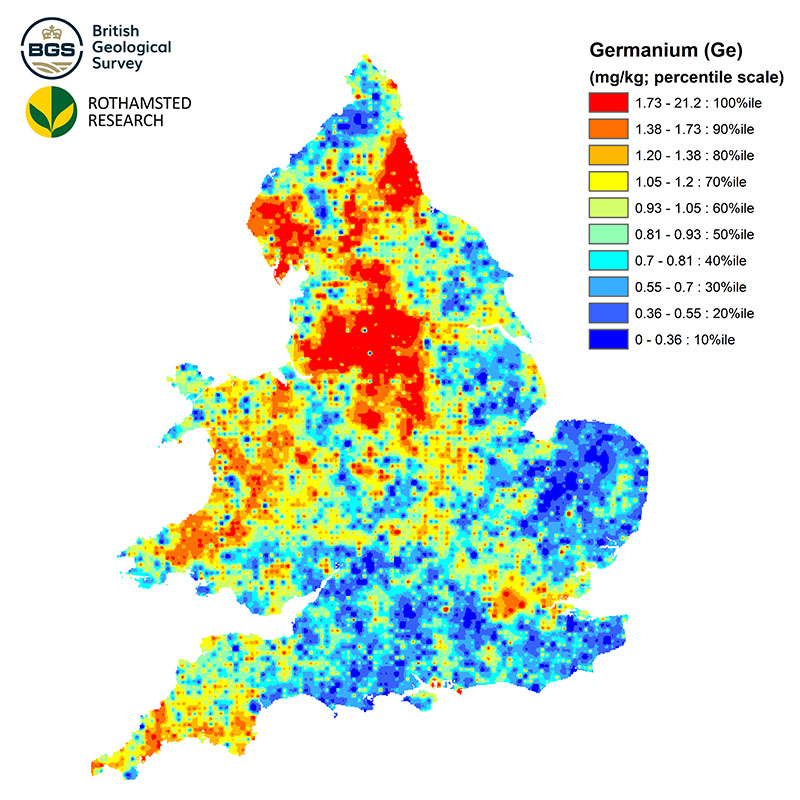
| Title | NSI Topsoil Germanium Concentrations |
|---|---|
| Source | British Geological Survey |
| Enquiries | enquiries@bgs.ac.uk |
| Scale(s) | 1km grid resolution |
| Coverage | England and Wales |
| Format | ESRI grid data (others available by request) |
| Price | The 1 km grid data is free for use under Open Government Licence terms |
| Uses | Local to national level use |
| Map Viewer | View in UKSO Map Viewer |
| WMS link | https://map.bgs.ac.uk/... |
| Images | High resolution | low resolution |
| Additional Media | 1km grid data |
The concentrations of hafnium were determined using wavelength dispersive X-ray fluorescence spectrometry with a lower limit of detection of 2 mg/kg and typical coefficients of variation of 20 % for repeated analyses of certified reference materials. The coefficient of variation (CV) expresses the error associated with subsampling and analysis; CV values of less than around 10 % suggest that analyses are reasonably accurate.

| Title | NSI Topsoil Hafnium Concentrations |
|---|---|
| Source | British Geological Survey |
| Enquiries | enquiries@bgs.ac.uk |
| Scale(s) | 1km grid resolution |
| Coverage | England and Wales |
| Format | ESRI grid data (others available by request) |
| Price | The 1 km grid data is free for use under Open Government Licence terms |
| Uses | Local to national level use |
| Map Viewer | View in UKSO Map Viewer |
| WMS link | https://map.bgs.ac.uk/... |
| Images | High resolution | low resolution |
| Additional Media | 1km grid data |
The concentrations of iodine were determined using energy dispersive X-ray fluorescence spectrometry with a lower limit of detection of 0.35 mg/kg and typical coefficients of variation of around 5 % for repeated analyses of certified reference materials. The coefficient of variation (CV) expresses the error associated with subsampling and analysis; CV values of less than around 10 % suggest that analyses are reasonably accurate.
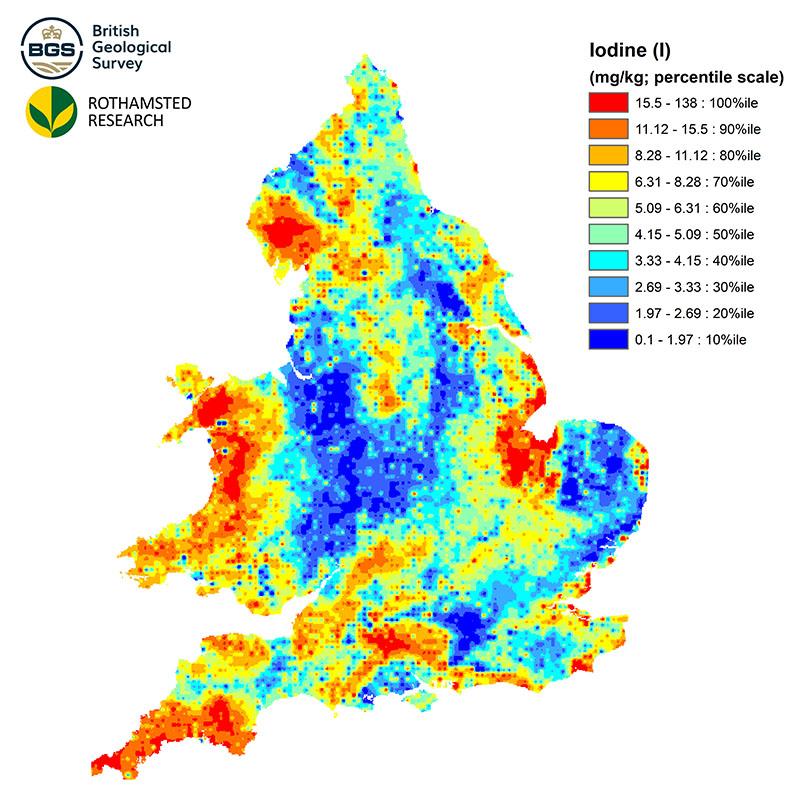
| Title | NSI Topsoil Iodine Concentrations |
|---|---|
| Source | British Geological Survey |
| Enquiries | enquiries@bgs.ac.uk |
| Scale(s) | 1km grid resolution |
| Coverage | England and Wales |
| Format | ESRI grid data (others available by request) |
| Price | The 1 km grid data is free for use under Open Government Licence terms |
| Uses | Local to national level use |
| Map Viewer | View in UKSO Map Viewer |
| WMS link | https://map.bgs.ac.uk/... |
| Images | High resolution | low resolution |
| Additional Media | 1km grid data |
The concentrations of iron were determined using wavelength dispersive X-ray fluorescence spectrometry with a lower limit of detection of 0.0049 % and typical coefficients of variation of around 1% for repeated analyses of certified reference materials. The coefficient of variation (CV) expresses the error associated with subsampling and analysis; CV values of less than around 10 % suggest that analyses are reasonably accurate.

| Title | NSI Topsoil Iron Concentrations |
|---|---|
| Source | British Geological Survey |
| Enquiries | enquiries@bgs.ac.uk |
| Scale(s) | 1km grid resolution |
| Coverage | England and Wales |
| Format | ESRI grid data (others available by request) |
| Price | The 1 km grid data is free for use under Open Government Licence terms |
| Uses | Local to national level use |
| Map Viewer | View in UKSO Map Viewer |
| WMS link | https://map.bgs.ac.uk/... |
| Images | High resolution | low resolution |
| Additional Media | 1km grid data |
The concentrations of lanthanum were determined using energy dispersive X-ray fluorescence spectrometry with a lower limit of detection of 0.6 mg/kg and typical coefficients of variation of around 1.5 % for repeated analyses of certified reference materials. The coefficient of variation (CV) expresses the error associated with subsampling and analysis; CV values of less than around 10 % suggest that analyses are reasonably accurate.
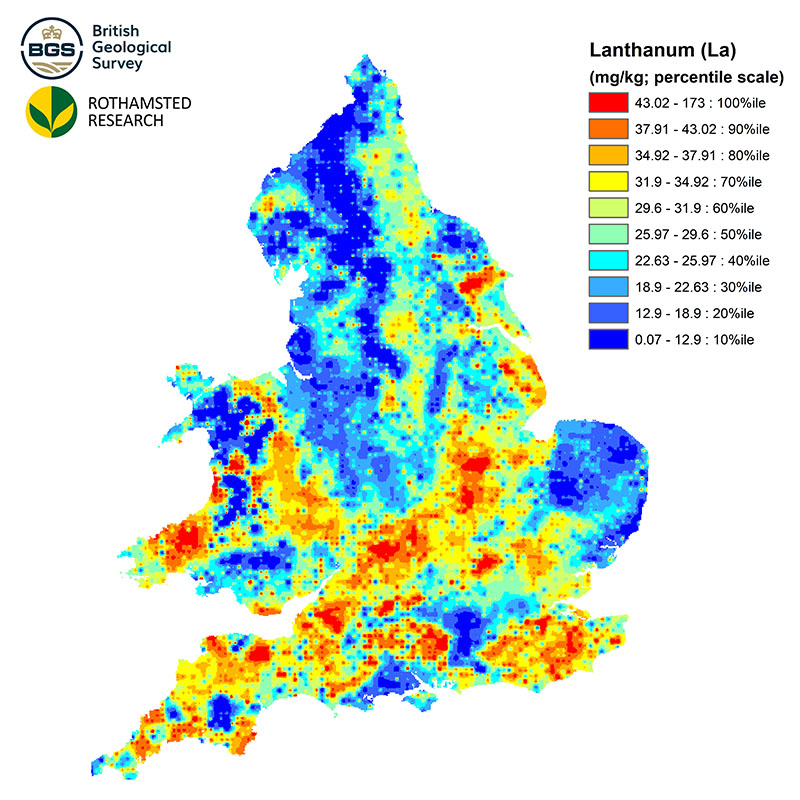
| Title | NSI Topsoil Lanthanum Concentrations |
|---|---|
| Source | British Geological Survey |
| Enquiries | enquiries@bgs.ac.uk |
| Scale(s) | 1km grid resolution |
| Coverage | England and Wales |
| Format | ESRI grid data (others available by request) |
| Price | The 1 km grid data is free for use under Open Government Licence terms |
| Uses | Local to national level use |
| Map Viewer | View in UKSO Map Viewer |
| WMS link | https://map.bgs.ac.uk/... |
| Images | High resolution | low resolution |
| Additional Media | 1km grid data |
The concentrations of lead were determined using wavelength dispersive X-ray fluorescence spectrometry with a lower limit of detection of 1.2 mg/kg and typical coefficients of variation of around 1.5 % for repeated analyses of certified reference materials. The coefficient of variation (CV) expresses the error associated with subsampling and analysis; CV values of less than around 10 % suggest that analyses are reasonably accurate.
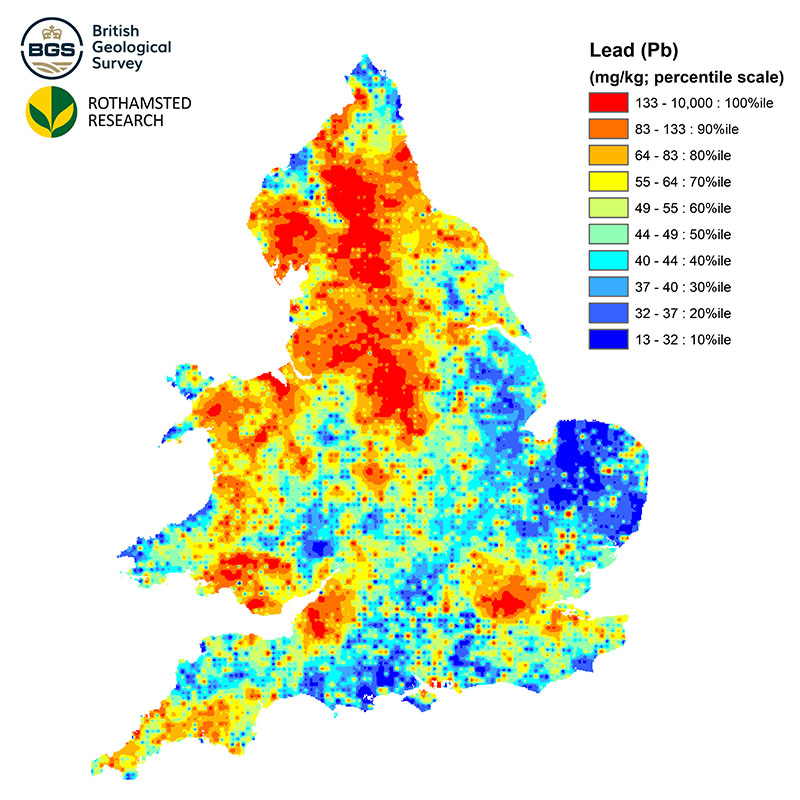
| Title | NSI Topsoil Lead Concentrations |
|---|---|
| Source | British Geological Survey |
| Enquiries | enquiries@bgs.ac.uk |
| Scale(s) | 1km grid resolution |
| Coverage | England and Wales |
| Format | ESRI grid data (others available by request) |
| Price | The 1 km grid data is free for use under Open Government Licence terms |
| Uses | Local to national level use |
| Map Viewer | View in UKSO Map Viewer |
| WMS link | https://map.bgs.ac.uk/... |
| Images | High resolution | low resolution |
| Additional Media | 1km grid data |
The concentrations of magnesium were determined using wavelength dispersive X-ray fluorescence spectrometry with a lower limit of detection of 0.109 % and typical coefficients of variation of around 4% for repeated analyses of certified reference materials. The coefficient of variation (CV) expresses the error associated with subsampling and analysis; CV values of less than around 10 % suggest that analyses are reasonably accurate.
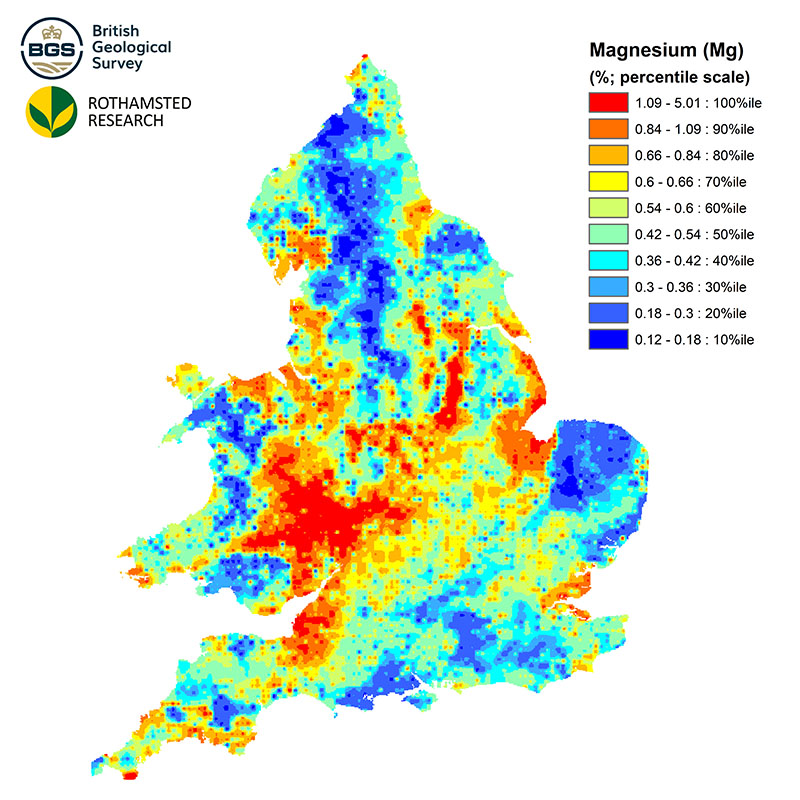
| Title | NSI Topsoil Magnesium Concentrations |
|---|---|
| Source | British Geological Survey |
| Enquiries | enquiries@bgs.ac.uk |
| Scale(s) | 1km grid resolution |
| Coverage | England and Wales |
| Format | ESRI grid data (others available by request) |
| Price | The 1 km grid data is free for use under Open Government Licence terms |
| Uses | Local to national level use |
| Map Viewer | View in UKSO Map Viewer |
| WMS link | https://map.bgs.ac.uk/... |
| Images | High resolution | low resolution |
| Additional Media | 1km grid data |
The concentrations of manganese were determined using wavelength dispersive X-ray fluorescence spectrometry with a lower limit of detection of 0.054 % and typical coefficients of variation of around 3% for repeated analyses of certified reference materials. The coefficient of variation (CV) expresses the error associated with subsampling and analysis; CV values of less than around 10 % suggest that analyses are reasonably accurate.
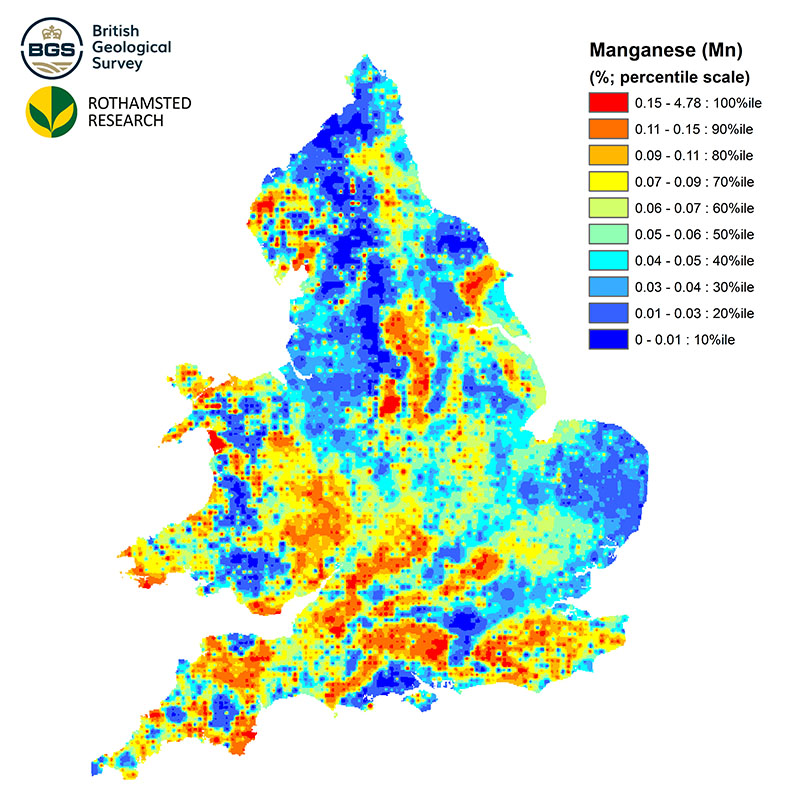
| Title | NSI Topsoil Manganese Concentrations |
|---|---|
| Source | British Geological Survey |
| Enquiries | enquiries@bgs.ac.uk |
| Scale(s) | 1km grid resolution |
| Coverage | England and Wales |
| Format | ESRI grid data (others available by request) |
| Price | The 1 km grid data is free for use under Open Government Licence terms |
| Uses | Local to national level use |
| Map Viewer | View in UKSO Map Viewer |
| WMS link | https://map.bgs.ac.uk/... |
| Images | High resolution | low resolution |
| Additional Media | 1km grid data |
The concentrations of molybdenum were determined using wavelength dispersive X-ray fluorescence spectrometry with a lower limit of detection of 0.2 mg/kg and typical coefficients of variation of around 6 % for repeated analyses of certified reference materials. The coefficient of variation (CV) expresses the error associated with subsampling and analysis; CV values of less than around 10 % suggest that analyses are reasonably accurate.
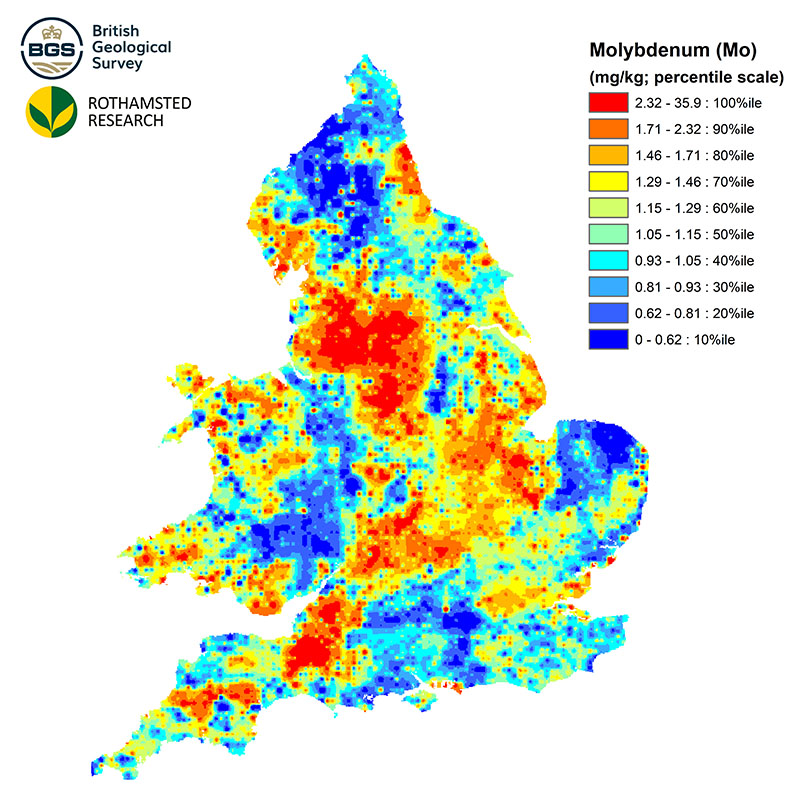
| Title | NSI Topsoil Molybdenum Concentrations |
|---|---|
| Source | British Geological Survey |
| Enquiries | enquiries@bgs.ac.uk |
| Scale(s) | 1km grid resolution |
| Coverage | England and Wales |
| Format | ESRI grid data (others available by request) |
| Price | The 1 km grid data is free for use under Open Government Licence terms |
| Uses | Local to national level use |
| Map Viewer | View in UKSO Map Viewer |
| WMS link | https://map.bgs.ac.uk/... |
| Images | High resolution | low resolution |
| Additional Media | 1km grid data |
The concentrations of neodymium were determined using wavelength dispersive X-ray fluorescence spectrometry with a lower limit of detection of 5 mg/kg and typical coefficients of variation of around 9 % for repeated analyses of certified reference materials. The coefficient of variation (CV) expresses the error associated with subsampling and analysis; CV values of less than around 10 % suggest that analyses are reasonably accurate.

| Title | NSI Topsoil Neodymium Concentrations |
|---|---|
| Source | British Geological Survey |
| Enquiries | enquiries@bgs.ac.uk |
| Scale(s) | 1km grid resolution |
| Coverage | England and Wales |
| Format | ESRI grid data (others available by request) |
| Price | The 1 km grid data is free for use under Open Government Licence terms |
| Uses | Local to national level use |
| Map Viewer | View in UKSO Map Viewer |
| WMS link | https://map.bgs.ac.uk/... |
| Images | High resolution | low resolution |
| Additional Media | 1km grid data |
The concentrations of nickel were determined using wavelength dispersive X-ray fluorescence spectrometry with a lower limit of detection of 1.3 mg/kg and typical coefficients of variation of around 3 % for repeated analyses of certified reference materials. The coefficient of variation (CV) expresses the error associated with subsampling and analysis; CV values of less than around 10 % suggest that analyses are reasonably accurate.
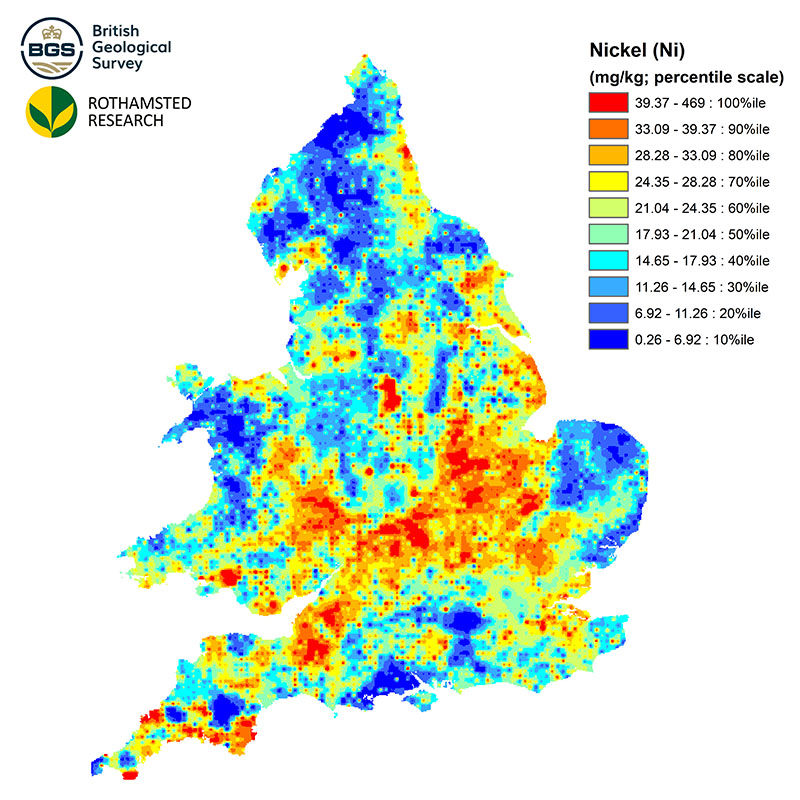
| Title | NSI Topsoil Nickel Concentrations |
|---|---|
| Source | British Geological Survey |
| Enquiries | enquiries@bgs.ac.uk |
| Scale(s) | 1km grid resolution |
| Coverage | England and Wales |
| Format | ESRI grid data (others available by request) |
| Price | The 1 km grid data is free for use under Open Government Licence terms |
| Uses | Local to national level use |
| Map Viewer | View in UKSO Map Viewer |
| WMS link | https://map.bgs.ac.uk/... |
| Images | High resolution | low resolution |
| Additional Media | 1km grid data |
The concentrations of niobium were determined using wavelength dispersive X-ray fluorescence spectrometry with a lower limit of detection of 0.7 mg/kg and typical coefficients of variation of around 5% for repeated analyses of certified reference materials. The coefficient of variation (CV) expresses the error associated with subsampling and analysis; CV values of less than around 10% suggest that analyses are reasonably accurate.
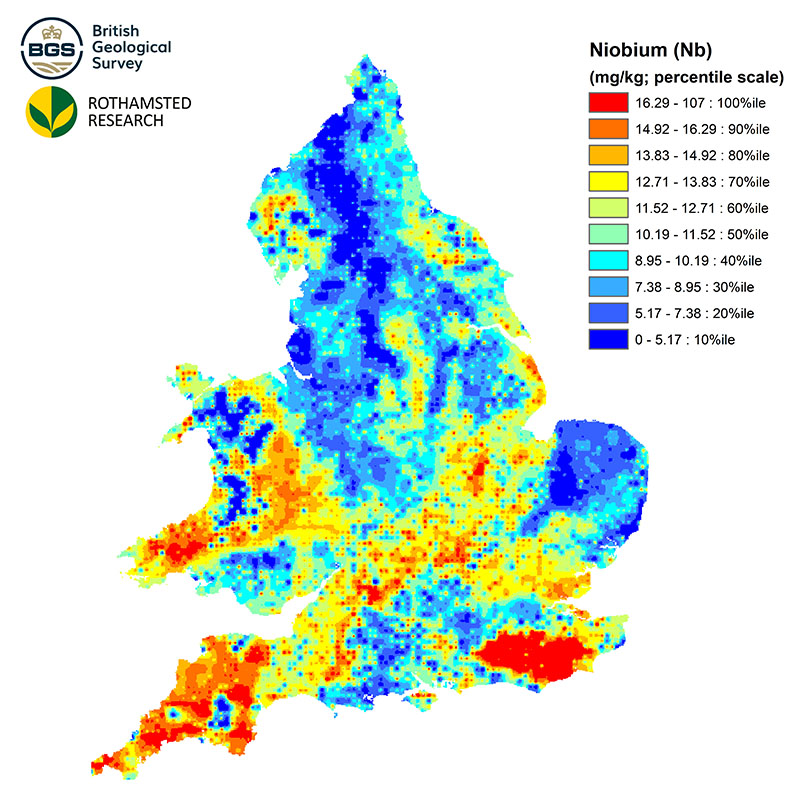
| Title | NSI Topsoil Niobium Concentrations |
|---|---|
| Source | British Geological Survey |
| Enquiries | enquiries@bgs.ac.uk |
| Scale(s) | 1km grid resolution |
| Coverage | England and Wales |
| Format | ESRI grid data (others available by request) |
| Price | The 1 km grid data is free for use under Open Government Licence terms |
| Uses | Local to national level use |
| Map Viewer | View in UKSO Map Viewer |
| WMS link | https://map.bgs.ac.uk/... |
| Images | High resolution | low resolution |
| Additional Media | 1km grid data |
The concentrations of phosphorus were determined using wavelength dispersive X-ray fluorescence spectrometry with a lower limit of detection of 0.087% and typical coefficients of variation of around 5% for repeated analyses of certified reference materials. The coefficient of variation (CV) expresses the error associated with subsampling and analysis; CV values of less than around 10 % suggest that analyses are reasonably accurate.
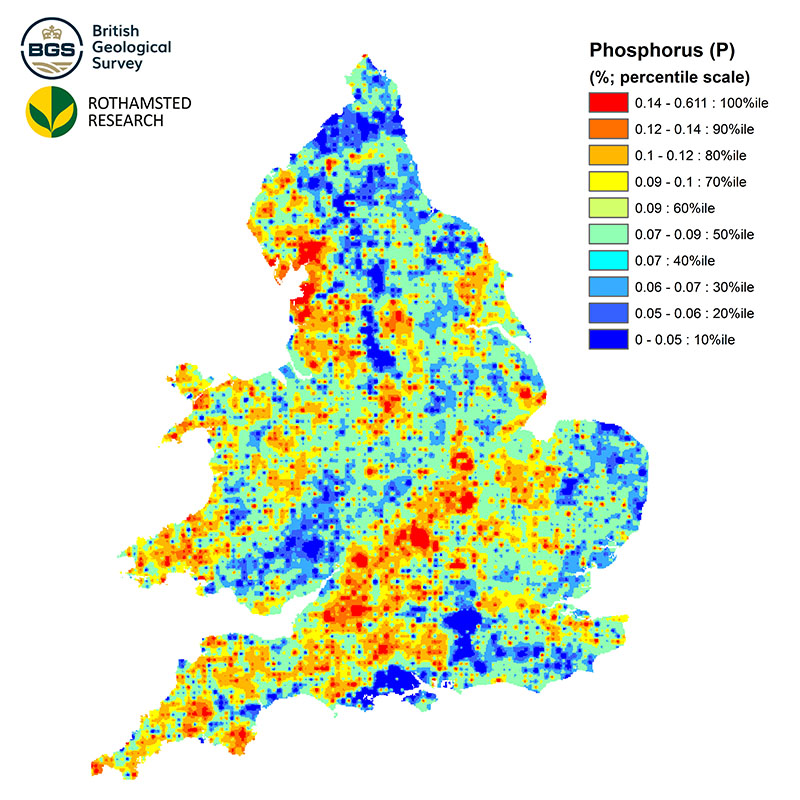
| Title | NSI Topsoil Phosphorus Concentrations |
|---|---|
| Source | British Geological Survey |
| Enquiries | enquiries@bgs.ac.uk |
| Scale(s) | 1km grid resolution |
| Coverage | England and Wales |
| Format | ESRI grid data (others available by request) |
| Price | The 1 km grid data is free for use under Open Government Licence terms |
| Uses | Local to national level use |
| Map Viewer | View in UKSO Map Viewer |
| WMS link | https://map.bgs.ac.uk/... |
| Images | High resolution | low resolution |
| Additional Media | 1km grid data |
The concentrations of potassium were determined using wavelength dispersive X-ray fluorescence spectrometry with a lower limit of detection of 0.0066% and typical coefficients of variation of around 3% for repeated analyses of certified reference materials. The coefficient of variation (CV) expresses the error associated with subsampling and analysis; CV values of less than around 10 % suggest that analyses are reasonably accurate.
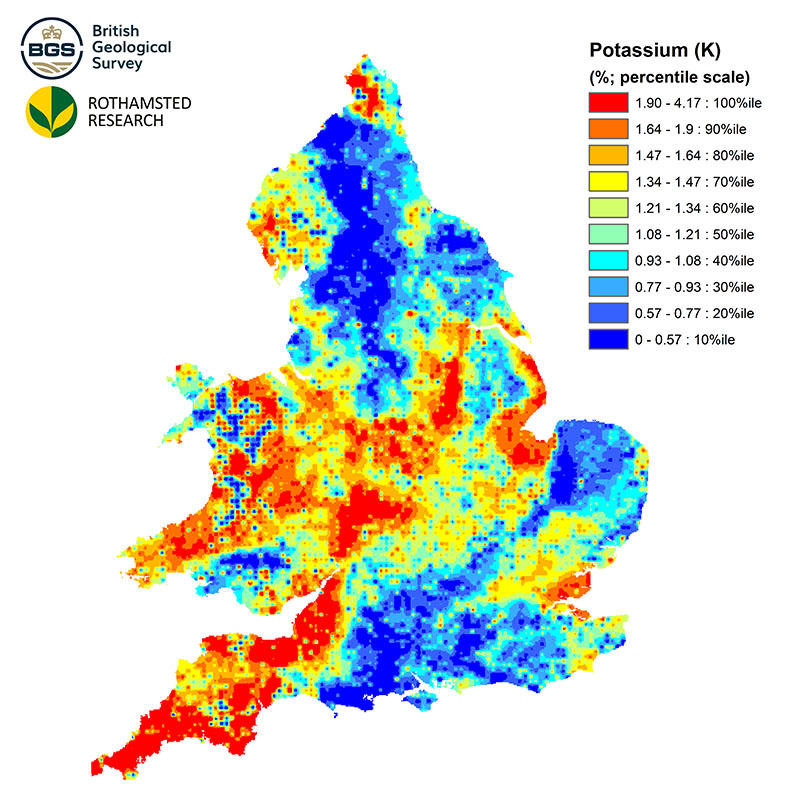
| Title | NSI Topsoil Potassium Concentrations |
|---|---|
| Source | British Geological Survey |
| Enquiries | enquiries@bgs.ac.uk |
| Scale(s) | 1km grid resolution |
| Coverage | England and Wales |
| Format | ESRI grid data (others available by request) |
| Price | The 1 km grid data is free for use under Open Government Licence terms |
| Uses | Local to national level use |
| Map Viewer | View in UKSO Map Viewer |
| WMS link | https://map.bgs.ac.uk/... |
| Images | High resolution | low resolution |
| Additional Media | 1km grid data |
The concentrations of rubidium were determined using wavelength dispersive X-ray fluorescence spectrometry with a lower limit of detection of 0.7 mg/kg and typical coefficients of variation of around 1.5% for repeated analyses of certified reference materials. The coefficient of variation (CV) expresses the error associated with subsampling and analysis; CV values of less than around 10% suggest that analyses are reasonably accurate.
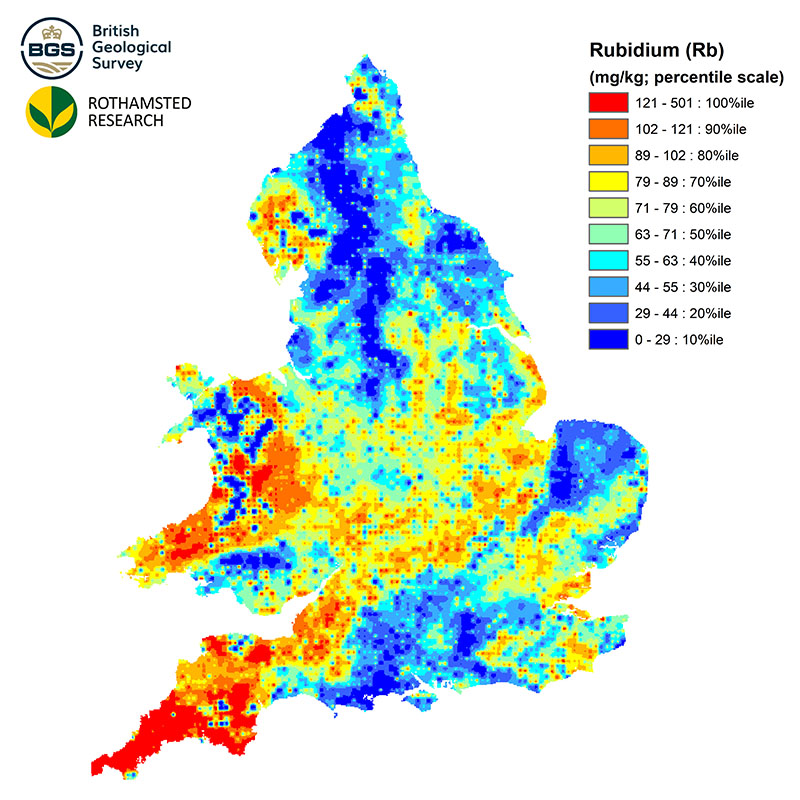
| Title | NSI Topsoil Rubidium Concentrations |
|---|---|
| Source | British Geological Survey |
| Enquiries | enquiries@bgs.ac.uk |
| Scale(s) | 1km grid resolution |
| Coverage | England and Wales |
| Format | ESRI grid data (others available by request) |
| Price | The 1 km grid data is free for use under Open Government Licence terms |
| Uses | Local to national level use |
| Map Viewer | View in UKSO Map Viewer |
| WMS link | https://map.bgs.ac.uk/... |
| Images | High resolution | low resolution |
| Additional Media | 1km grid data |
The concentrations of samarium were determined using wavelength dispersive X-ray fluorescence spectrometry with a lower limit of detection of 3 mg/kg and typical coefficients of variation of around 30% for repeated analyses of certified reference materials. The coefficient of variation (CV) expresses the error associated with subsampling and analysis; CV values of less than around 10% suggest that analyses are reasonably accurate.
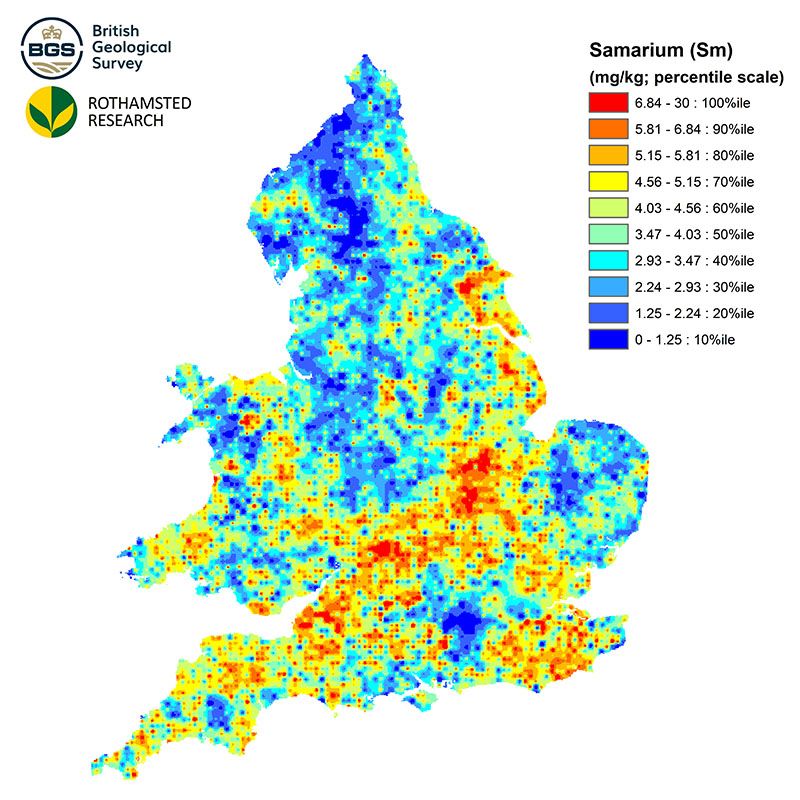
| Title | NSI Topsoil Samarium Concentrations |
|---|---|
| Source | British Geological Survey |
| Enquiries | enquiries@bgs.ac.uk |
| Scale(s) | 1km grid resolution |
| Coverage | England and Wales |
| Format | ESRI grid data (others available by request) |
| Price | The 1 km grid data is free for use under Open Government Licence terms |
| Uses | Local to national level use |
| Map Viewer | View in UKSO Map Viewer |
| WMS link | https://map.bgs.ac.uk/... |
| Images | High resolution | low resolution |
| Additional Media | 1km grid data |
The concentrations of Scandium were determined using wavelength dispersive X-ray fluorescence spectrometry with a lower limit of detection of 2.4 mg/kg and typical coefficients of variation of around 12% for repeated analyses of certified reference materials. The coefficient of variation (CV) expresses the error associated with subsampling and analysis; CV values of less than around 10% suggest that analyses are reasonably accurate.
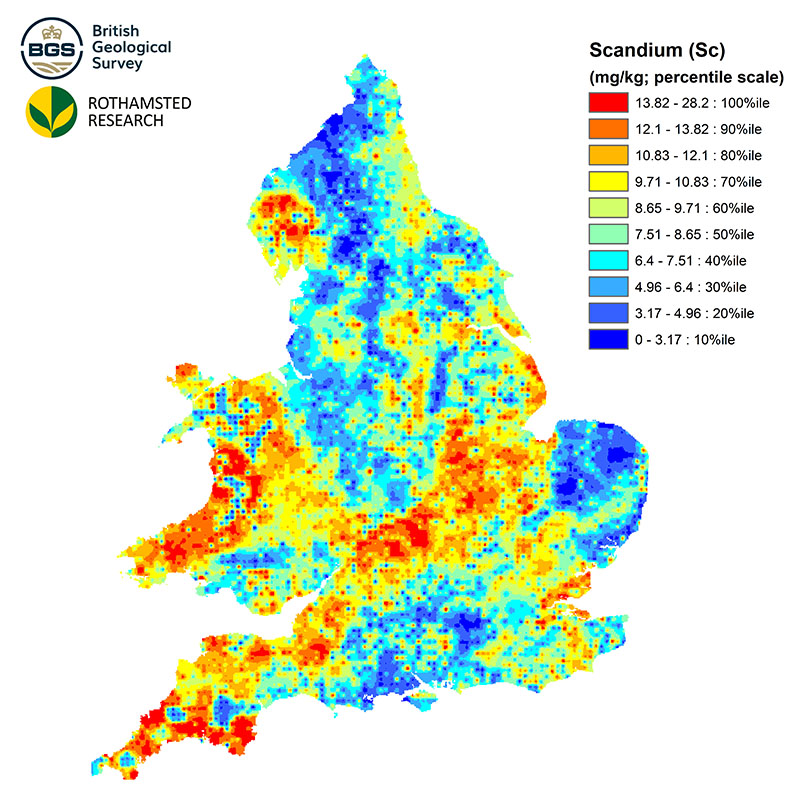
| Title | NSI Topsoil Scandium Concentrations |
|---|---|
| Source | British Geological Survey |
| Enquiries | enquiries@bgs.ac.uk |
| Scale(s) | 1km grid resolution |
| Coverage | England and Wales |
| Format | ESRI grid data (others available by request) |
| Price | The 1 km grid data is free for use under Open Government Licence terms |
| Uses | Local to national level use |
| Map Viewer | View in UKSO Map Viewer |
| WMS link | https://map.bgs.ac.uk/... |
| Images | High resolution | low resolution |
| Additional Media | 1km grid data |
The concentrations of selenium were determined using energy dispersive X-ray fluorescence spectrometry with a lower limit of detection of 0.1 mg/kg and typical coefficients of variation of around 5% for repeated analyses of certified reference materials. The coefficient of variation (CV) expresses the error associated with subsampling and analysis; CV values of less than around 10% suggest that analyses are reasonably accurate.
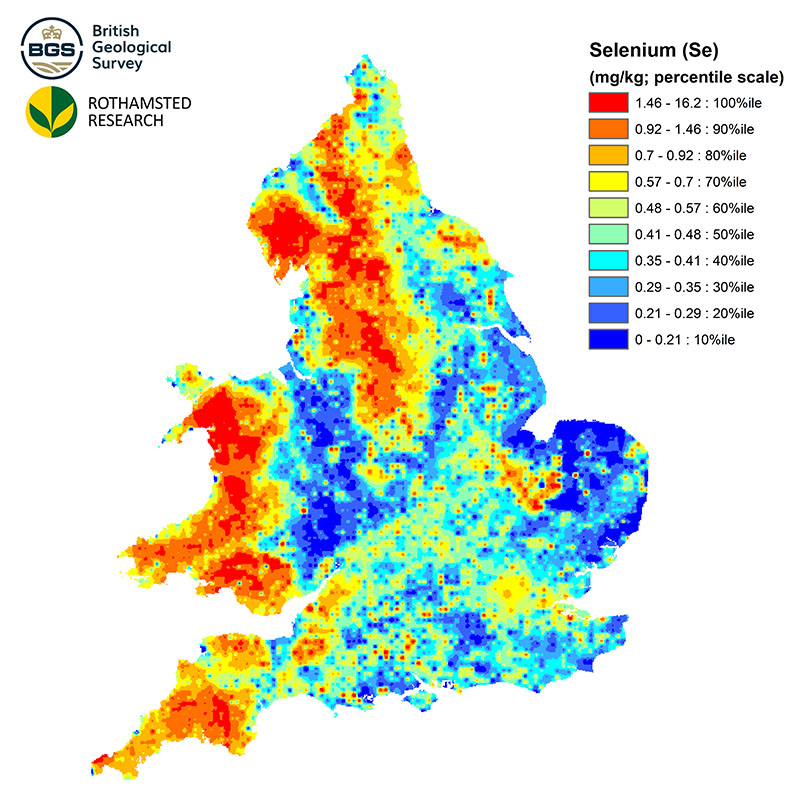
| Title | NSI Topsoil Selenium Concentrations |
|---|---|
| Source | British Geological Survey |
| Enquiries | enquiries@bgs.ac.uk |
| Scale(s) | 1km grid resolution |
| Coverage | England and Wales |
| Format | ESRI grid data (others available by request) |
| Price | The 1 km grid data is free for use under Open Government Licence terms |
| Uses | Local to national level use |
| Map Viewer | View in UKSO Map Viewer |
| WMS link | https://map.bgs.ac.uk/... |
| Images | High resolution | low resolution |
| Additional Media | 1km grid data |
The concentrations of silicon were determined using wavelength dispersive X-ray fluorescence spectrometry with a lower limit of detection of 0.023% and typical coefficients of variation of around 3% for repeated analyses of certified reference materials. The coefficient of variation (CV) expresses the error associated with subsampling and analysis; CV values of less than around 10% suggest that analyses are reasonably accurate.
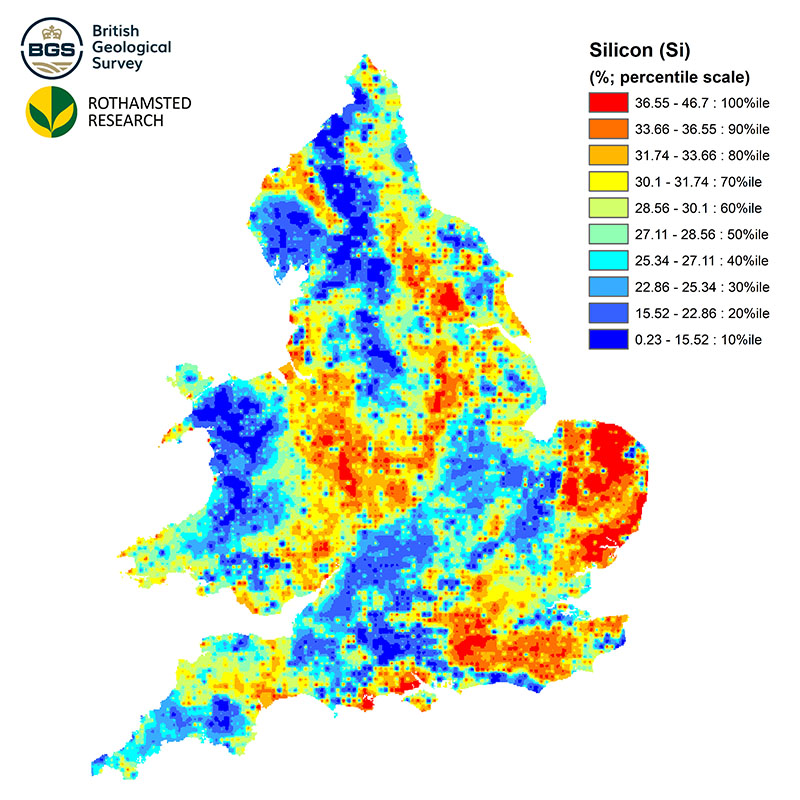
| Title | NSI Topsoil Silicon Concentrations |
|---|---|
| Source | British Geological Survey |
| Enquiries | enquiries@bgs.ac.uk |
| Scale(s) | 1km grid resolution |
| Coverage | England and Wales |
| Format | ESRI grid data (others available by request) |
| Price | The 1 km grid data is free for use under Open Government Licence terms |
| Uses | Local to national level use |
| Map Viewer | View in UKSO Map Viewer |
| WMS link | https://map.bgs.ac.uk/... |
| Images | High resolution | low resolution |
| Additional Media | 1km grid data |
The concentrations of silver were determined using energy dispersive X-ray fluorescence spectrometry with a lower limit of detection of 0.25 mg/kg and typical coefficients of variation of around 40% for repeated analyses of certified reference materials. The coefficient of variation (CV) expresses the error associated with subsampling and analysis; CV values of less than around 10% suggest that analyses are reasonably accurate.

| Title | NSI Topsoil Silver Concentrations |
|---|---|
| Source | British Geological Survey |
| Enquiries | enquiries@bgs.ac.uk |
| Scale(s) | 1km grid resolution |
| Coverage | England and Wales |
| Format | ESRI grid data (others available by request) |
| Price | The 1 km grid data is free for use under Open Government Licence terms |
| Uses | Local to national level use |
| Map Viewer | View in UKSO Map Viewer |
| WMS link | https://map.bgs.ac.uk/... |
| Images | High resolution | low resolution |
| Additional Media | 1km grid data |
The concentrations of sodium were determined using wavelength dispersive X-ray fluorescence spectrometry with a lower limit of detection of 0.2% and typical coefficients of variation of around 6% for repeated analyses of certified reference materials. The coefficient of variation (CV) expresses the error associated with subsampling and analysis; CV values of less than around 10% suggest that analyses are reasonably accurate.

| Title | NSI Topsoil Sodium Concentrations |
|---|---|
| Source | British Geological Survey |
| Enquiries | enquiries@bgs.ac.uk |
| Scale(s) | 1km grid resolution |
| Coverage | England and Wales |
| Format | ESRI grid data (others available by request) |
| Price | The 1 km grid data is free for use under Open Government Licence terms |
| Uses | Local to national level use |
| Map Viewer | View in UKSO Map Viewer |
| WMS link | https://map.bgs.ac.uk/... |
| Images | High resolution | low resolution |
| Additional Media | 1km grid data |
The concentrations of strontium were determined using wavelength dispersive X-ray fluorescence spectrometry with a lower limit of detection of 0.8 mg/kg and typical coefficients of variation of around 1% for repeated analyses of certified reference materials. The coefficient of variation (CV) expresses the error associated with subsampling and analysis; CV values of less than around 10% suggest that analyses are reasonably accurate.
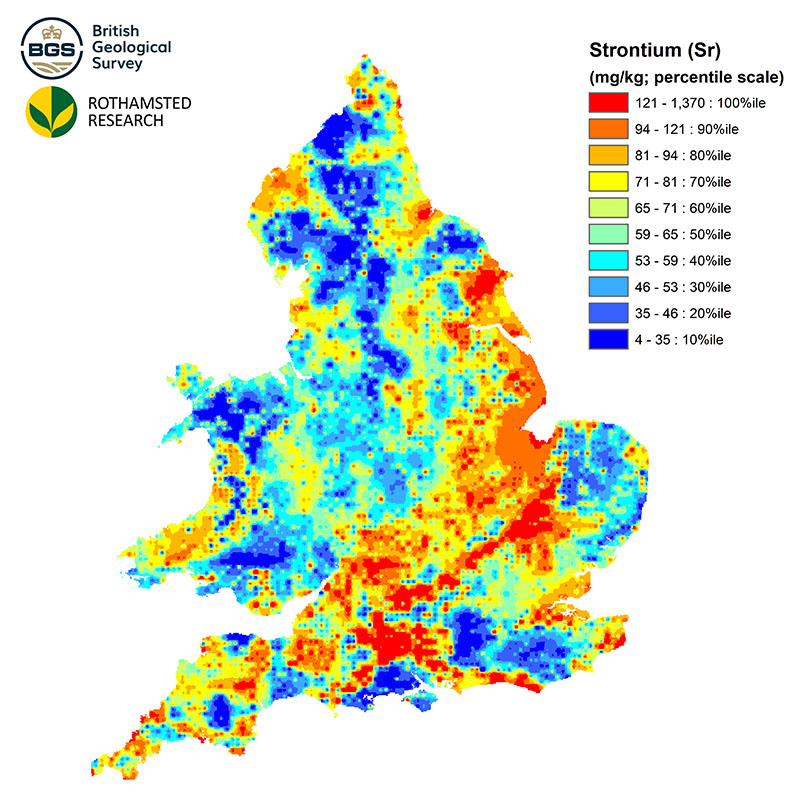
| Title | NSI Topsoil Strontium Concentrations |
|---|---|
| Source | British Geological Survey |
| Enquiries | enquiries@bgs.ac.uk |
| Scale(s) | 1km grid resolution |
| Coverage | England and Wales |
| Format | ESRI grid data (others available by request) |
| Price | The 1 km grid data is free for use under Open Government Licence terms |
| Uses | Local to national level use |
| Map Viewer | View in UKSO Map Viewer |
| WMS link | https://map.bgs.ac.uk/... |
| Images | High resolution | low resolution |
| Additional Media | 1km grid data |
The concentrations of sulphur were determined using wavelength dispersive X-ray fluorescence spectrometry with a lower limit of detection of 801 mg/kg and typical coefficients of variation of around 10% for repeated analyses of certified reference materials. The coefficient of variation (CV) expresses the error associated with subsampling and analysis; CV values of less than around 10% suggest that analyses are reasonably accurate.

| Title | NSI Topsoil Sulphur Concentrations |
|---|---|
| Source | British Geological Survey |
| Enquiries | enquiries@bgs.ac.uk |
| Scale(s) | 1km grid resolution |
| Coverage | England and Wales |
| Format | ESRI grid data (others available by request) |
| Price | The 1 km grid data is free for use under Open Government Licence terms |
| Uses | Local to national level use |
| Map Viewer | View in UKSO Map Viewer |
| WMS link | https://map.bgs.ac.uk/... |
| Images | High resolution | low resolution |
| Additional Media | 1km grid data |
The concentrations of tantalum were determined using wavelength dispersive X-ray fluorescence spectrometry with a lower limit of detection of 1.1 mg/kg and typical coefficients of variation of >30% for repeated analyses of certified reference materials. The coefficient of variation (CV) expresses the error associated with subsampling and analysis; CV values of less than around 10% suggest that analyses are reasonably accurate.
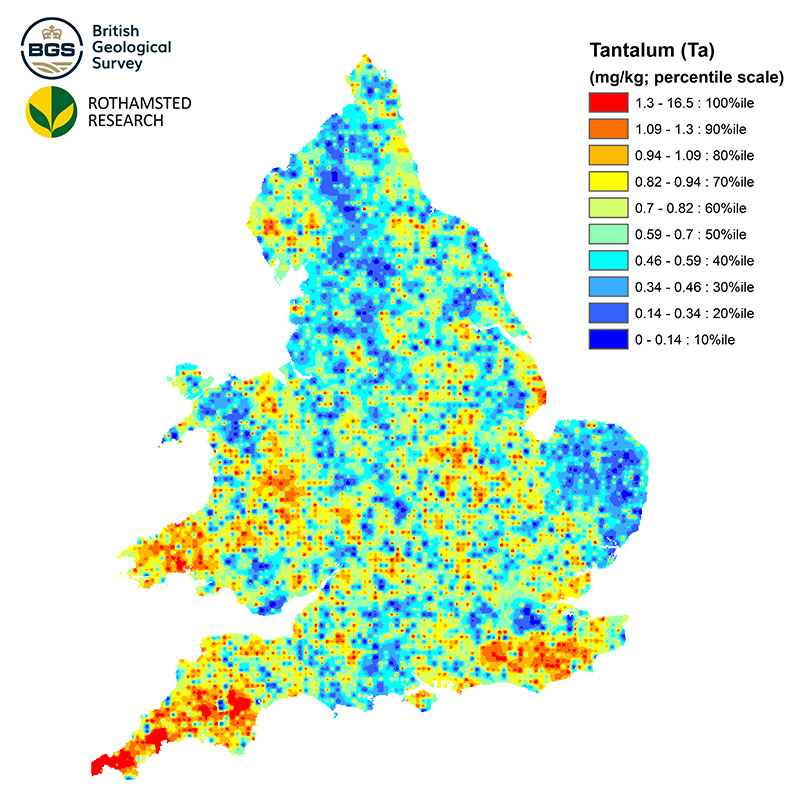
| Title | NSI Topsoil Tantalum Concentrations |
|---|---|
| Source | British Geological Survey |
| Enquiries | enquiries@bgs.ac.uk |
| Scale(s) | 1km grid resolution |
| Coverage | England and Wales |
| Format | ESRI grid data (others available by request) |
| Price | The 1 km grid data is free for use under Open Government Licence terms |
| Uses | Local to national level use |
| Map Viewer | View in UKSO Map Viewer |
| WMS link | https://map.bgs.ac.uk/... |
| Images | High resolution | low resolution |
| Additional Media | 1km grid data |
The concentrations of thallium were determined using energy dispersive X-ray fluorescence spectrometry with a lower limit of detection of 0.35 mg/kg and typical coefficients of variation of around 25% for repeated analyses of certified reference materials. The coefficient of variation (CV) expresses the error associated with subsampling and analysis; CV values of less than around 10% suggest that analyses are reasonably accurate.
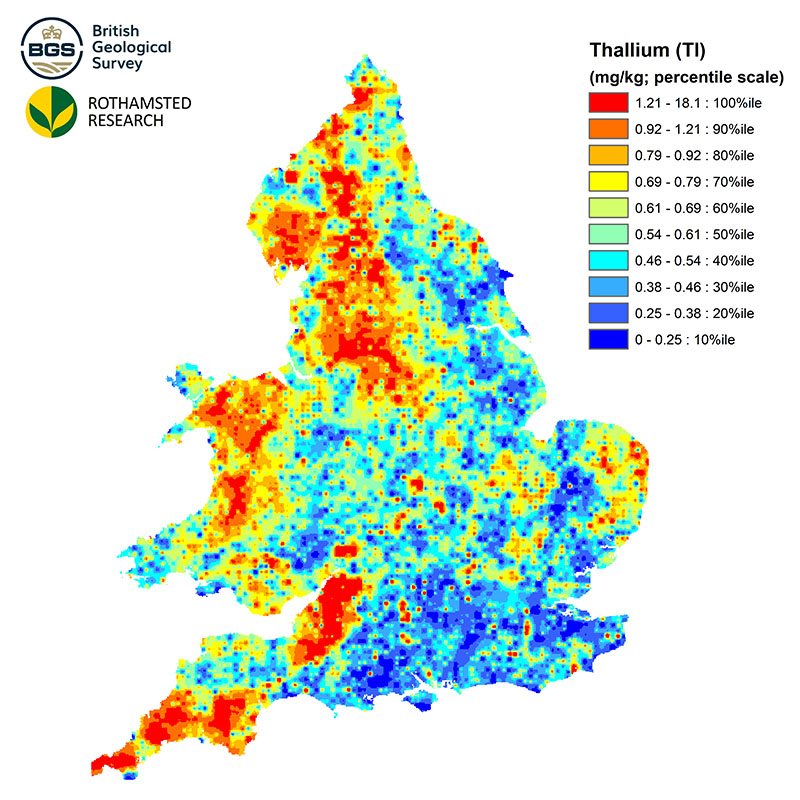
| Title | NSI Topsoil Thallium Concentrations |
|---|---|
| Source | British Geological Survey |
| Enquiries | enquiries@bgs.ac.uk |
| Scale(s) | 1km grid resolution |
| Coverage | England and Wales |
| Format | ESRI grid data (others available by request) |
| Price | The 1 km grid data is free for use under Open Government Licence terms |
| Uses | Local to national level use |
| Map Viewer | View in UKSO Map Viewer |
| WMS link | https://map.bgs.ac.uk/... |
| Images | High resolution | low resolution |
| Additional Media | 1km grid data |
The concentrations of thorium were determined using energy dispersive X-ray fluorescence spectrometry with a lower limit of detection of 0.7 mg/kg and typical coefficients of variation of around 7% for repeated analyses of certified reference materials. The coefficient of variation (CV) expresses the error associated with subsampling and analysis; CV values of less than around 10% suggest that analyses are reasonably accurate.
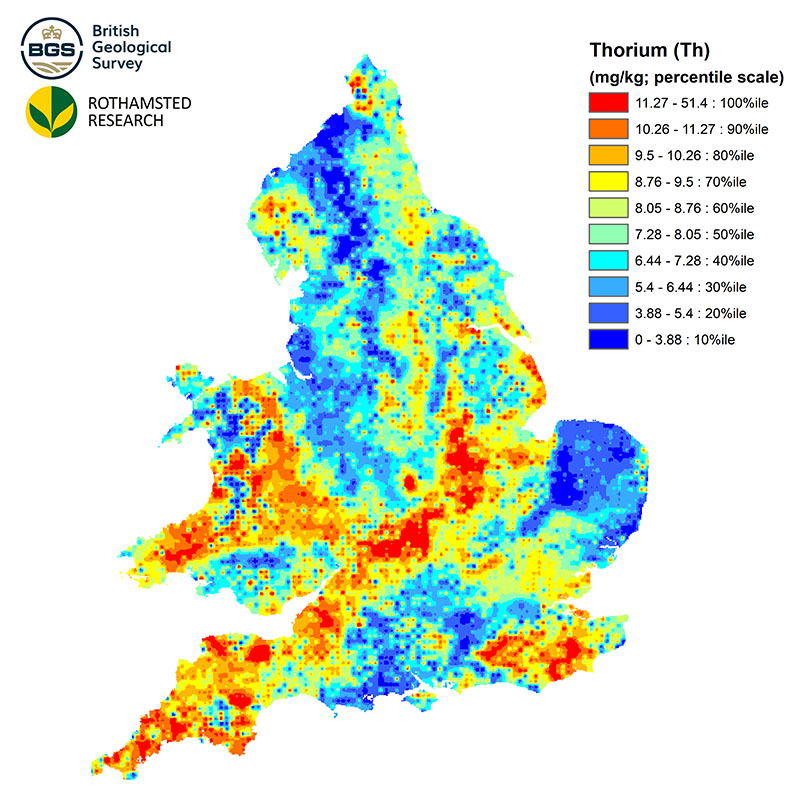
| Title | NSI Topsoil Thorium Concentrations |
|---|---|
| Source | British Geological Survey |
| Enquiries | enquiries@bgs.ac.uk |
| Scale(s) | 1km grid resolution |
| Coverage | England and Wales |
| Format | ESRI grid data (others available by request) |
| Price | The 1 km grid data is free for use under Open Government Licence terms |
| Uses | Local to national level use |
| Map Viewer | View in UKSO Map Viewer |
| WMS link | https://map.bgs.ac.uk/... |
| Images | High resolution | low resolution |
| Additional Media | 1km grid data |
The concentrations of tin were determined using energy dispersive X-ray fluorescence spectrometry with a lower limit of detection of 0.25 mg/kg and typical coefficients of variation of around 3% for repeated analyses of certified reference materials. The coefficient of variation (CV) expresses the error associated with subsampling and analysis; CV values of less than around 10% suggest that analyses are reasonably accurate.

| Title | NSI Topsoil Tin Concentrations |
|---|---|
| Source | British Geological Survey |
| Enquiries | enquiries@bgs.ac.uk |
| Scale(s) | 1km grid resolution |
| Coverage | England and Wales |
| Format | ESRI grid data (others available by request) |
| Price | The 1 km grid data is free for use under Open Government Licence terms |
| Uses | Local to national level use |
| Map Viewer | View in UKSO Map Viewer |
| WMS link | https://map.bgs.ac.uk/... |
| Images | High resolution | low resolution |
| Additional Media | 1km grid data |
The concentrations of titanium were determined using wavelength dispersive X-ray fluorescence spectrometry with a lower limit of detection of 801 mg/kg and typical coefficients of variation of around 10% for repeated analyses of certified reference materials. The coefficient of variation (CV) expresses the error associated with subsampling and analysis; CV values of less than around 10% suggest that analyses are reasonably accurate.
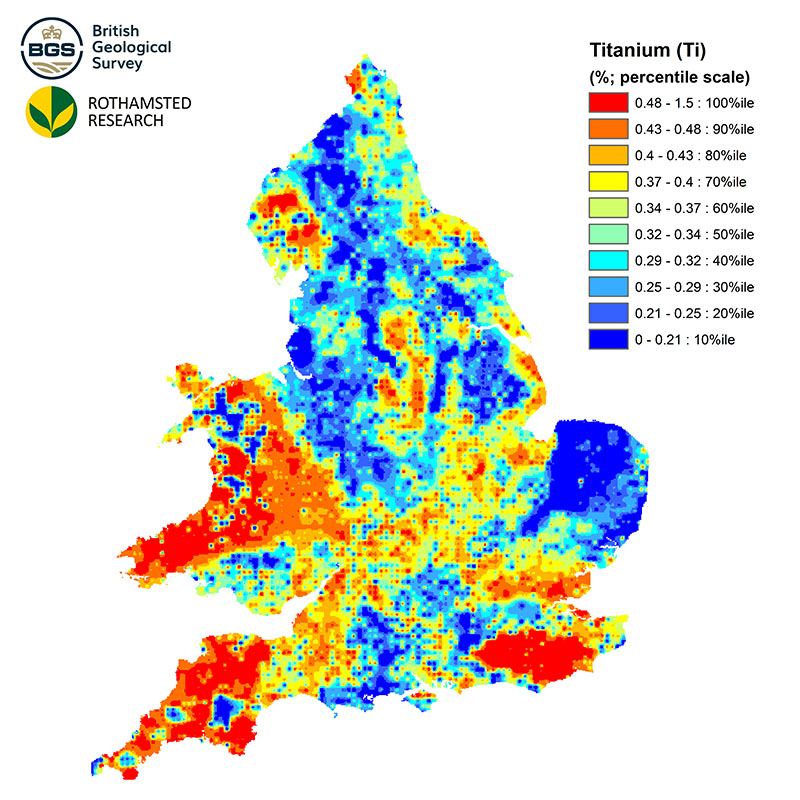
| Title | NSI Topsoil Titanium Concentrations |
|---|---|
| Source | British Geological Survey |
| Enquiries | enquiries@bgs.ac.uk |
| Scale(s) | 1km grid resolution |
| Coverage | England and Wales |
| Format | ESRI grid data (others available by request) |
| Price | The 1 km grid data is free for use under Open Government Licence terms |
| Uses | Local to national level use |
| Map Viewer | View in UKSO Map Viewer |
| WMS link | https://map.bgs.ac.uk/... |
| Images | High resolution | low resolution |
| Additional Media | 1km grid data |
The concentrations of tungsten were determined using wavelength dispersive X-ray fluorescence spectrometry with a lower limit of detection of 0.6 mg/kg and typical coefficients of variation of around 10% for repeated analyses of certified reference materials. The coefficient of variation (CV) expresses the error associated with subsampling and analysis; CV values of less than around 10% suggest that analyses are reasonably accurate.
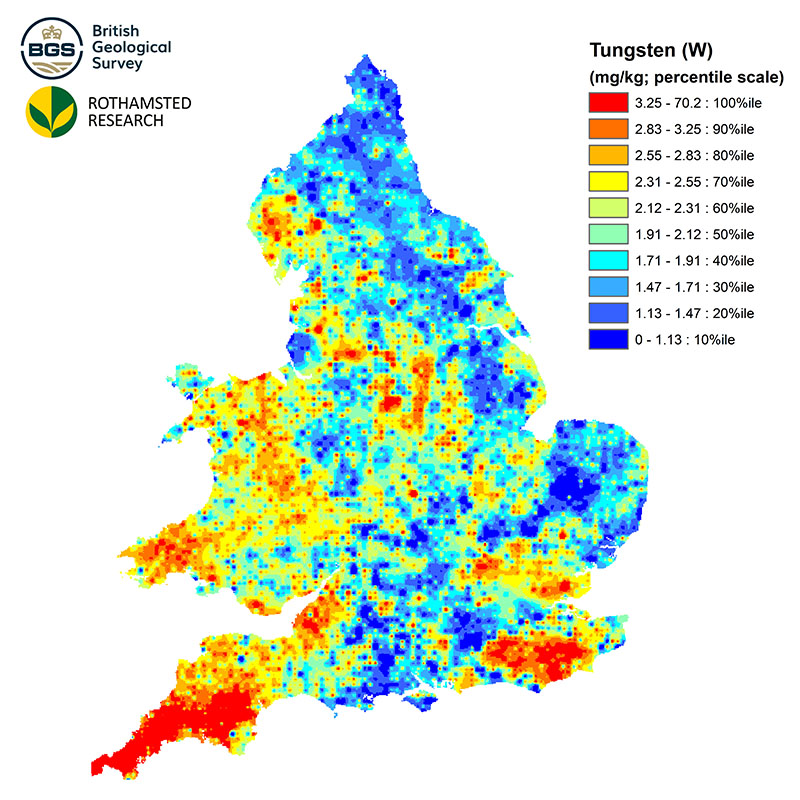
| Title | NSI Topsoil Tungsten Concentrations |
|---|---|
| Source | British Geological Survey |
| Enquiries | enquiries@bgs.ac.uk |
| Scale(s) | 1km grid resolution |
| Coverage | England and Wales |
| Format | ESRI grid data (others available by request) |
| Price | The 1 km grid data is free for use under Open Government Licence terms |
| Uses | Local to national level use |
| Map Viewer | View in UKSO Map Viewer |
| WMS link | https://map.bgs.ac.uk/... |
| Images | High resolution | low resolution |
| Additional Media | 1km grid data |
The concentrations of uranium were determined using wavelength dispersive X-ray fluorescence spectrometry with a lower limit of detection of 0.7 mg/kg and typical coefficients of variation of around 5% for repeated analyses of certified reference materials. The coefficient of variation (CV) expresses the error associated with subsampling and analysis; CV values of less than around 10% suggest that analyses are reasonably accurate.
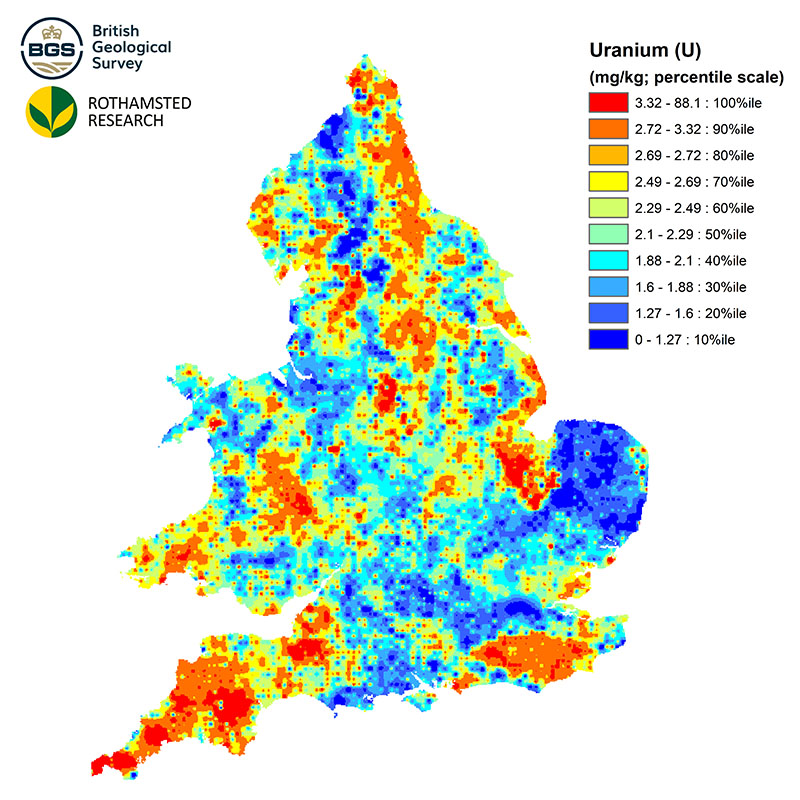
| Title | NSI Topsoil Uranium Concentrations |
|---|---|
| Source | British Geological Survey |
| Enquiries | enquiries@bgs.ac.uk |
| Scale(s) | 1km grid resolution |
| Coverage | England and Wales |
| Format | ESRI grid data (others available by request) |
| Price | The 1 km grid data is free for use under Open Government Licence terms |
| Uses | Local to national level use |
| Map Viewer | View in UKSO Map Viewer |
| WMS link | https://map.bgs.ac.uk/... |
| Images | High resolution | low resolution |
| Additional Media | 1km grid data |
The concentrations of vanadium were determined using wavelength dispersive X-ray fluorescence spectrometry with a lower limit of detection of 2.7 mg/kg and typical coefficients of variation of around 2% for repeated analyses of certified reference materials. The coefficient of variation (CV) expresses the error associated with subsampling and analysis; CV values of less than around 10% suggest that analyses are reasonably accurate.

| Title | NSI Topsoil Vanadium Concentrations |
|---|---|
| Source | British Geological Survey |
| Enquiries | enquiries@bgs.ac.uk |
| Scale(s) | 1km grid resolution |
| Coverage | England and Wales |
| Format | ESRI grid data (others available by request) |
| Price | The 1 km grid data is free for use under Open Government Licence terms |
| Uses | Local to national level use |
| Map Viewer | View in UKSO Map Viewer |
| WMS link | https://map.bgs.ac.uk/... |
| Images | High resolution | low resolution |
| Additional Media | 1km grid data |
The concentrations of ytterbium were determined using wavelength dispersive X-ray fluorescence spectrometry with a lower limit of detection of 1.3 mg/kg and typical coefficients of variation of around 25% for repeated analyses of certified reference materials. The coefficient of variation (CV) expresses the error associated with subsampling and analysis; CV values of less than around 10% suggest that analyses are reasonably accurate.
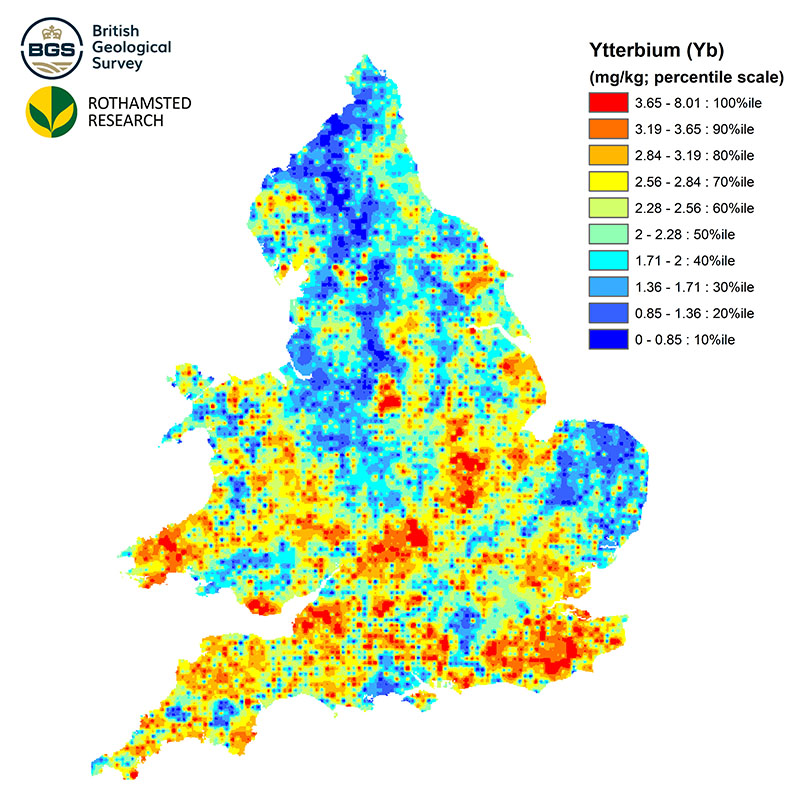
| Title | NSI Topsoil Ytterbium Concentrations |
|---|---|
| Source | British Geological Survey |
| Enquiries | enquiries@bgs.ac.uk |
| Scale(s) | 1km grid resolution |
| Coverage | England and Wales |
| Format | ESRI grid data (others available by request) |
| Price | The 1 km grid data is free for use under Open Government Licence terms |
| Uses | Local to national level use |
| Map Viewer | View in UKSO Map Viewer |
| WMS link | https://map.bgs.ac.uk/... |
| Images | High resolution | low resolution |
| Additional Media | 1km grid data |
The concentrations of yttrium were determined using wavelength dispersive X-ray fluorescence spectrometry with a lower limit of detection of 2.4 mg/kg and typical coefficients of variation of around 12% for repeated analyses of certified reference materials. The coefficient of variation (CV) expresses the error associated with subsampling and analysis; CV values of less than around 10% suggest that analyses are reasonably accurate.
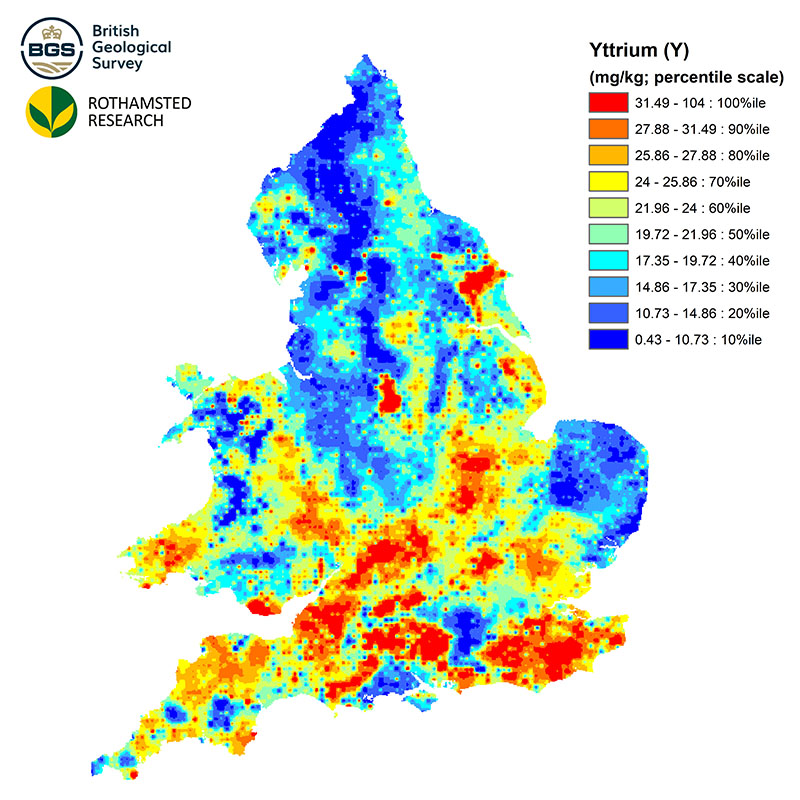
| Title | NSI Topsoil Yttrium Concentrations |
|---|---|
| Source | British Geological Survey |
| Enquiries | enquiries@bgs.ac.uk |
| Scale(s) | 1km grid resolution |
| Coverage | England and Wales |
| Format | ESRI grid data (others available by request) |
| Price | The 1 km grid data is free for use under Open Government Licence terms |
| Uses | Local to national level use |
| Map Viewer | View in UKSO Map Viewer |
| WMS link | https://map.bgs.ac.uk/... |
| Images | High resolution | low resolution |
| Additional Media | 1km grid data |
The concentrations of zinc were determined using wavelength dispersive X-ray fluorescence spectrometry with a lower limit of detection of 1.1 mg/kg and typical coefficients of variation of around 3% for repeated analyses of certified reference materials. The coefficient of variation (CV) expresses the error associated with subsampling and analysis; CV values of less than around 10% suggest that analyses are reasonably accurate.
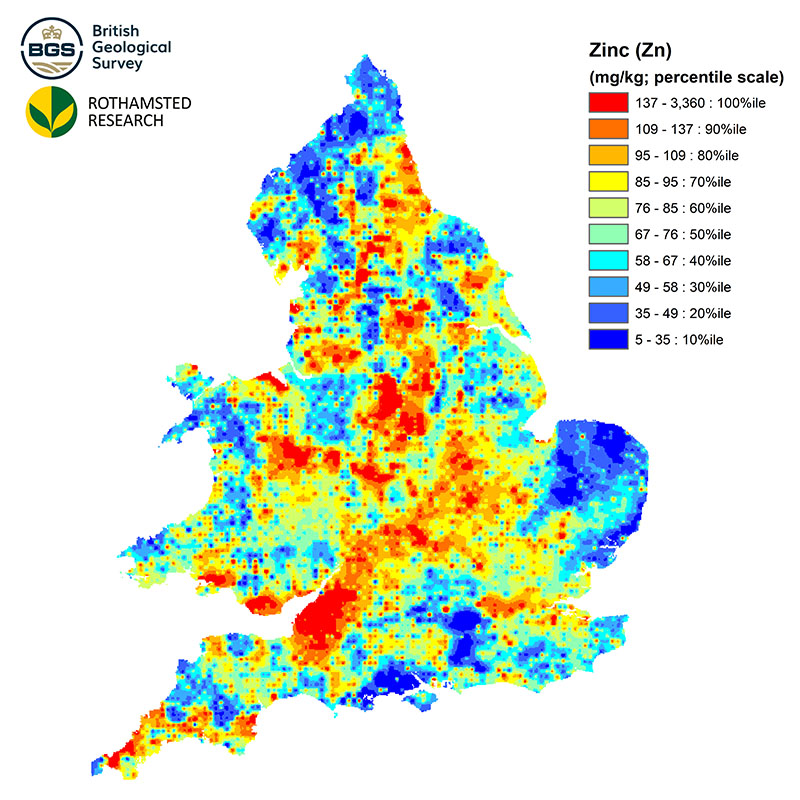
| Title | NSI Topsoil Zinc Concentrations |
|---|---|
| Source | British Geological Survey |
| Enquiries | enquiries@bgs.ac.uk |
| Scale(s) | 1km grid resolution |
| Coverage | England and Wales |
| Format | ESRI grid data (others available by request) |
| Price | The 1 km grid data is free for use under Open Government Licence terms |
| Uses | Local to national level use |
| Map Viewer | View in UKSO Map Viewer |
| WMS link | https://map.bgs.ac.uk/... |
| Images | High resolution | low resolution |
| Additional Media | 1km grid data |
The concentrations of zirconium were determined using energy dispersive X-ray fluorescence spectrometry with a lower limit of detection of 0.8 mg/kg and typical coefficients of variation of around 2% for repeated analyses of certified reference materials. The coefficient of variation (CV) expresses the error associated with subsampling and analysis; CV values of less than around 10% suggest that analyses are reasonably accurate.
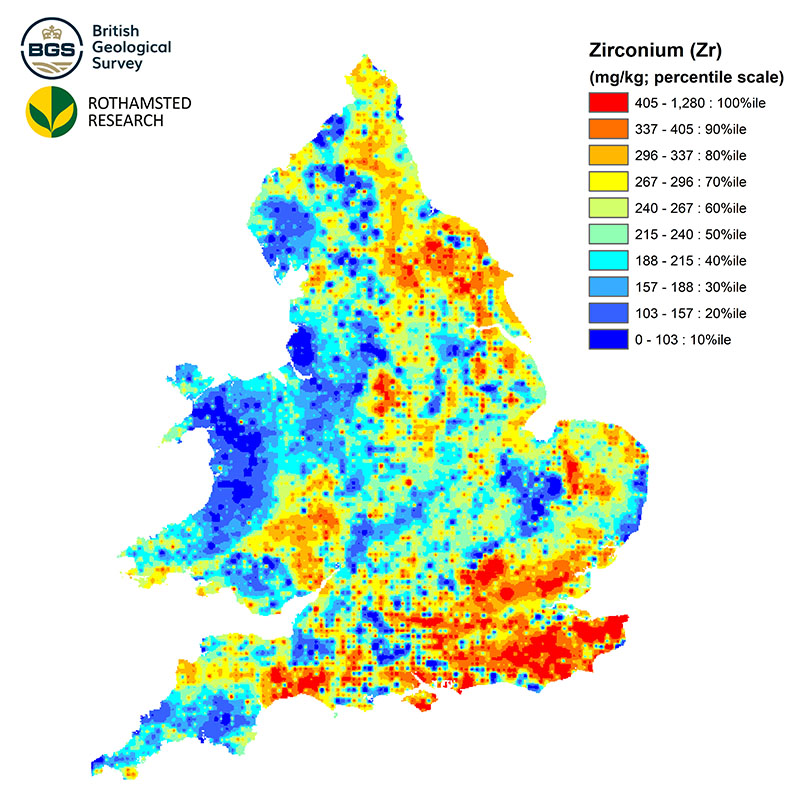
| Title | NSI Topsoil Zirconium Concentrations |
|---|---|
| Source | British Geological Survey |
| Enquiries | enquiries@bgs.ac.uk |
| Scale(s) | 1km grid resolution |
| Coverage | England and Wales |
| Format | ESRI grid data (others available by request) |
| Price | The 1 km grid data is free for use under Open Government Licence terms |
| Uses | Local to national level use |
| Map Viewer | View in UKSO Map Viewer |
| WMS link | https://map.bgs.ac.uk/... |
| Images | High resolution | low resolution |
| Additional Media | 1km grid data |