Select an option from the list below to view high resolution images and data about airborne geophysical data in South West Britain.
The TellusSW project acquired airborne geophysical for the counties of Cornwall and parts of Devon and Somerset. The maps of the geophysical data and their derivatives are provided to facilitate spatial comparison with, and modelling of, the soil, geological and environmental aspects of the data. The data can be downloaded from the TellusSW project website.
The survey, conducted in the second half of 2013, comprised a high resolution magnetic/magnetic gradient survey combined with a multichannel (256 channel) radiometric survey. The survey was carried out using 200m (N-S) line separations at a mean elevation of 91m, it provided 60,323 line-km of data.
These data are delivered under the terms of the Open Government Licence, subject to the following acknowledgement accompanying the reproduced BGS materials: "Contains British Geological Survey materials © NERC [2014]".
The map shows the derived Analytic Signal (AS) of the observed Total Magnetic Intensity (TMI) anomaly field. The colour scheme is based on an equal-area scheme such that each colour occupies an equal area on the map. Shaded relief from the NE.
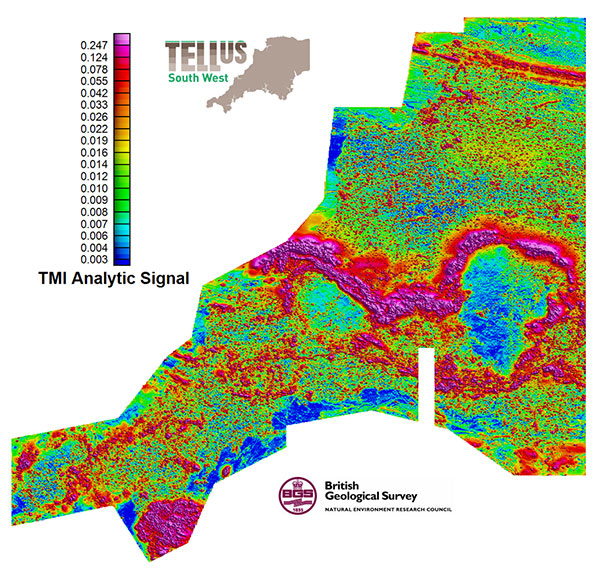
| Title | TellusSW airborne geophysics - Magnetic data: Derived AS of the TMI |
|---|---|
| Source | British Geological Survey |
| Enquiries | enquiries@bgs.ac.uk |
| Scale(s) | 40m square grid |
| Coverage | South West England |
| Format | GEOTIFF (embedded georeference) image and CSV files |
| Price | The GEOTIFF is free for use under Open Government Licence terms |
| Uses | Local to regional level use |
| Map Viewer | View in UKSO Map Viewer |
| WMS link | https://map.bgs.ac.uk/... |
| Images | High resolution | low resolution |
The map shows the derived Total Horizontal Gradient Magnitude (THGM) of the Reduced to Pole, Total Magnetic Intensity (TMI) anomaly field. The colour scheme is based on an equal-area scheme such that each colour occupies an equal area on the map. Shaded relief from the NE.
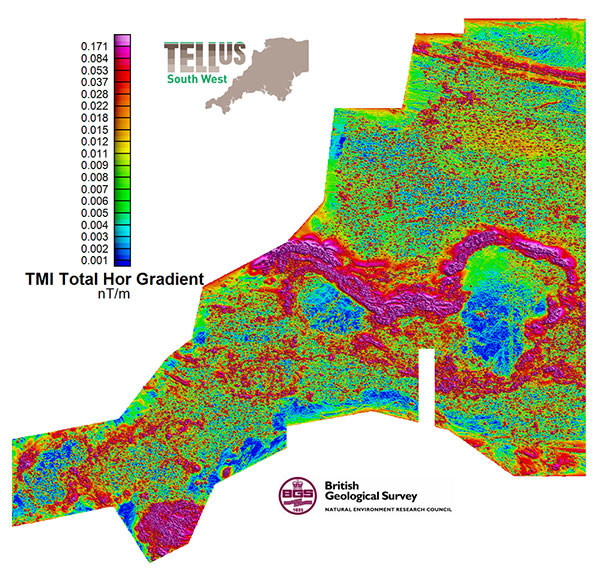
| Title | TellusSW airborne geophysics - Magnetic data: Derived THGM of the reduced to pole |
|---|---|
| Source | British Geological Survey |
| Enquiries | enquiries@bgs.ac.uk |
| Scale(s) | 40m square grid |
| Coverage | South West England |
| Format | GEOTIFF (embedded georeference) image and CSV files |
| Price | The GEOTIFF is free for use under Open Government Licence terms |
| Uses | Local to regional level use |
| Map Viewer | View in UKSO Map Viewer |
| WMS link | https://map.bgs.ac.uk/... |
| Images | High resolution | low resolution |
The map shows the derived Horizontal Gradient of the PseudoGravity of the Total Magnetic Intensity (TMI) anomaly field. The colour scheme is based on an equal-area scheme such that each colour occupies an equal area on the map. Shaded relief from the NE.
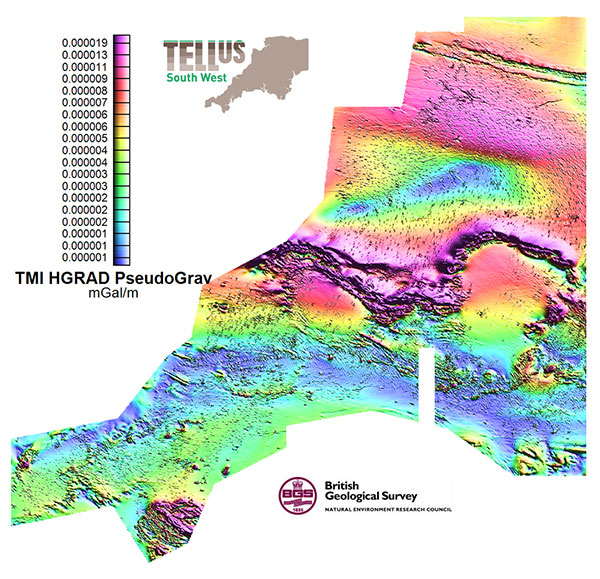
| Title | TellusSW airborne geophysics - Magnetic data: Derived horizontal gradient of the pseudogravity of the TMI |
|---|---|
| Source | British Geological Survey |
| Enquiries | enquiries@bgs.ac.uk |
| Scale(s) | 40m square grid |
| Coverage | South West England |
| Format | GEOTIFF (embedded georeference) image and CSV files |
| Price | The GEOTIFF is free for use under Open Government Licence terms |
| Uses | Local to regional level use |
| Map Viewer | View in UKSO Map Viewer |
| WMS link | https://map.bgs.ac.uk/... |
| Images | High resolution | low resolution |
The map shows the Total Magnetic Intensity (TMI), corrected for International Geomagnetic Reference Field (IGRF), to provide the TMI anomaly field. The colour scheme is based on an equal-area scheme such that each colour occupies an equal area on the map. Shaded relief from the NE.
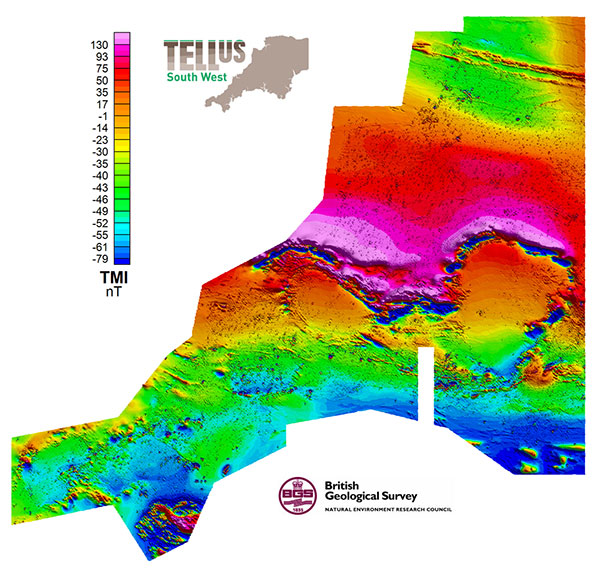
| Title | TellusSW airborne geophysics - Magnetic data: TMI, corrected for IGRF, to provide the TMI anomaly field |
|---|---|
| Source | British Geological Survey |
| Enquiries | enquiries@bgs.ac.uk |
| Scale(s) | 40m square grid |
| Coverage | South West England |
| Format | GEOTIFF (embedded georeference) image and CSV files |
| Price | The GEOTIFF is free for use under Open Government Licence terms |
| Uses | Local to regional level use |
| Map Viewer | View in UKSO Map Viewer |
| WMS link | https://map.bgs.ac.uk/... |
| Images | High resolution | low resolution |
The map shows the derived PseudoGravity of the Total Magnetic Intensity (TMI) anomaly field. The colour scheme is based on an equal-area scheme such that each colour occupies an equal area on the map. Shaded relief from the NE
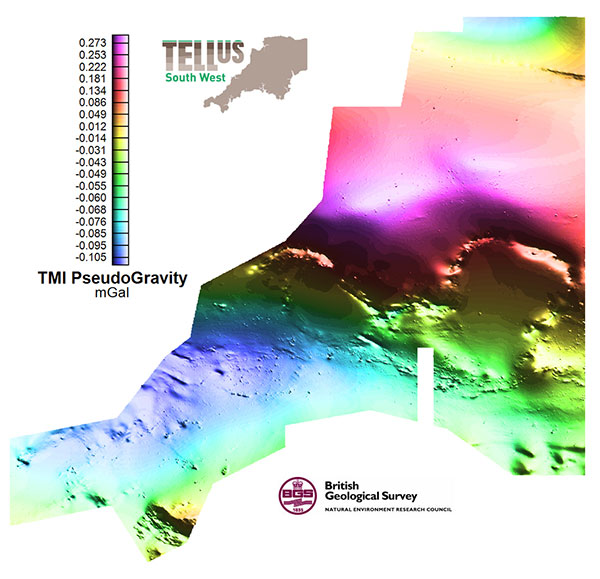
| Title | TellusSW airborne geophysics - Magnetic data: Derived pseudogravity of the TMI |
|---|---|
| Source | British Geological Survey |
| Enquiries | enquiries@bgs.ac.uk |
| Scale(s) | 40m square grid |
| Coverage | South West England |
| Format | GEOTIFF (embedded georeference) image and CSV files |
| Price | The GEOTIFF is free for use under Open Government Licence terms |
| Uses | Local to regional level use |
| Map Viewer | View in UKSO Map Viewer |
| WMS link | https://map.bgs.ac.uk/... |
| Images | High resolution | low resolution |
The map shows the derived First Vertical Derivative (FVD) of the Reduced to Pole, Total Magnetic Intensity (TMI) anomaly field. The colour scheme is based on an equal-area scheme such that each colour occupies an equal area on the map. Shaded relief from the NE.
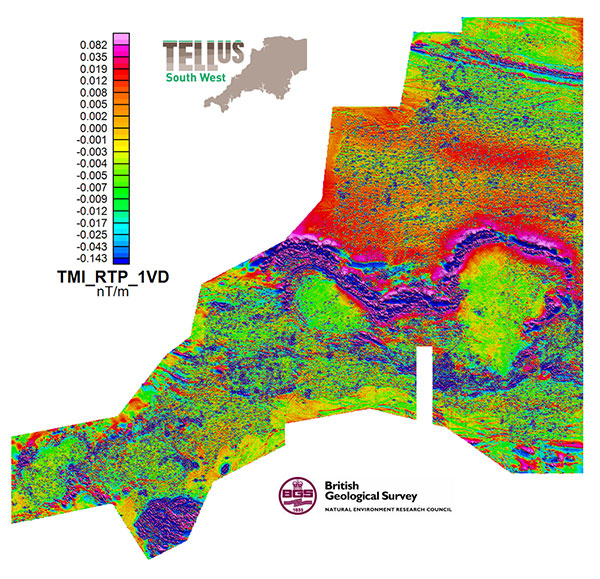
| Title | TellusSW airborne geophysics - Magnetic data: Derived FVD of the reduced to pole |
|---|---|
| Source | British Geological Survey |
| Enquiries | enquiries@bgs.ac.uk |
| Scale(s) | 40m square grid |
| Coverage | South West England |
| Format | GEOTIFF (embedded georeference) image and CSV files |
| Price | The GEOTIFF is free for use under Open Government Licence terms |
| Uses | Local to regional level use |
| Map Viewer | View in UKSO Map Viewer |
| WMS link | https://map.bgs.ac.uk/... |
| Images | High resolution | low resolution |
The map shows the derived Tilt Derivative (TD) of the Reduced to Pole, Total Magnetic Intensity (TMI) anomaly field. The colour scheme is based on an equal-area scheme such that each colour occupies an equal area on the map. Shaded relief from the NE.
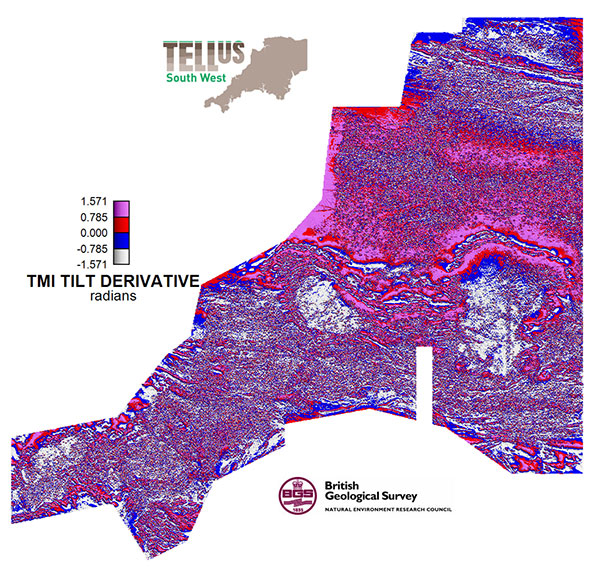
| Title | TellusSW airborne geophysics - Magnetic data: Derived TD of the reduced to pole |
|---|---|
| Source | British Geological Survey |
| Enquiries | enquiries@bgs.ac.uk |
| Scale(s) | 40m square grid |
| Coverage | South West England |
| Format | GEOTIFF (embedded georeference) image and CSV files |
| Price | The GEOTIFF is free for use under Open Government Licence terms |
| Uses | Local to regional level use |
| Map Viewer | View in UKSO Map Viewer |
| WMS link | https://map.bgs.ac.uk/... |
| Images | High resolution | low resolution |
The map shows the derived Potassium to Thorium ratio. The colour scheme is based on an equal-area scheme such that each colour occupies an equal area on the map. Shaded relief is from the NE.
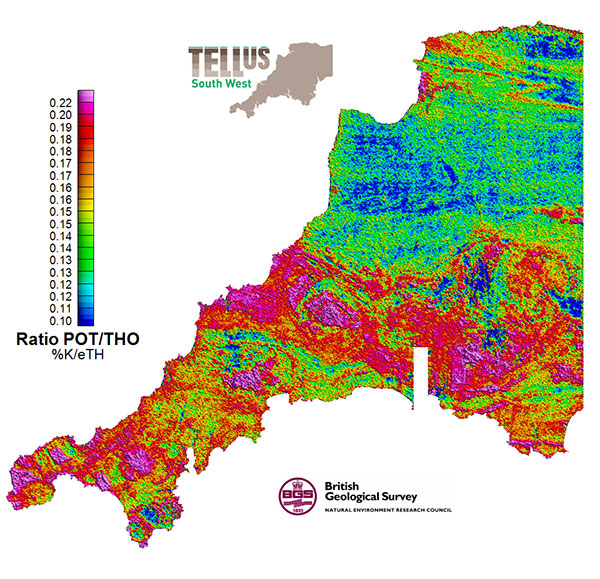
| Title | TellusSW airborne geophysics - Radiometric data: Derived Potassium to Thorium ratio |
|---|---|
| Source | British Geological Survey |
| Enquiries | enquiries@bgs.ac.uk |
| Scale(s) | 40m square grid |
| Coverage | South West England |
| Format | GEOTIFF (embedded georeference) image and CSV files |
| Price | The GEOTIFF is free for use under Open Government Licence terms |
| Uses | Local to regional level use |
| Map Viewer | View in UKSO Map Viewer |
| WMS link | https://map.bgs.ac.uk/... |
| Images | High resolution | low resolution |
The map shows the observed Potassium ground concentrations. The colour scheme is based on an equal-area scheme such that each colour occupies an equal area on the map. Shaded relief is from the NE.
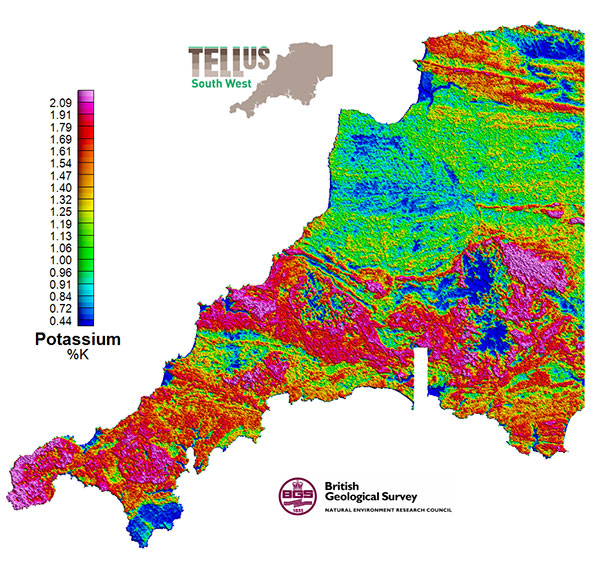
| Title | TellusSW airborne geophysics - Radiometric data: Observed Potassium ground concentrations |
|---|---|
| Source | British Geological Survey |
| Enquiries | enquiries@bgs.ac.uk |
| Scale(s) | 40m square grid |
| Coverage | South West England |
| Format | GEOTIFF (embedded georeference) image and CSV files |
| Price | The GEOTIFF is free for use under Open Government Licence terms |
| Uses | Local to regional level use |
| Map Viewer | View in UKSO Map Viewer |
| WMS link | https://map.bgs.ac.uk/... |
| Images | High resolution | low resolution |
The map shows the Ternary image obtained from the ground concentrations in Potassium (POT, %K), Thorium (THO, eTh) and Uranium (URA, eU). The RGB colour scheme is based on a 3-way colour stretch of the three radioelements
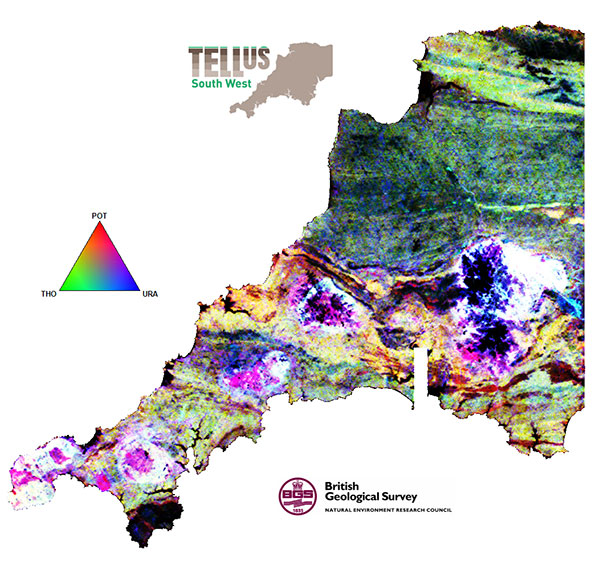
| Title | TellusSW airborne geophysics - Ternary image obtained from the ground concentrations in Potassium (POT, %K), Thorium (THO, eTh) and Uranium (URA, eU) |
|---|---|
| Source | British Geological Survey |
| Enquiries | enquiries@bgs.ac.uk |
| Scale(s) | 40m square grid |
| Coverage | South West England |
| Format | GEOTIFF (embedded georeference) image and CSV files |
| Price | The GEOTIFF is free for use under Open Government Licence terms |
| Uses | Local to regional level use |
| Map Viewer | View in UKSO Map Viewer |
| WMS link | https://map.bgs.ac.uk/... |
| Images | High resolution | low resolution |
The map shows the observed Thorium ground concentrations. The colour scheme is based on an equal-area scheme such that each colour occupies an equal area on the map. Shaded relief is from the NE.
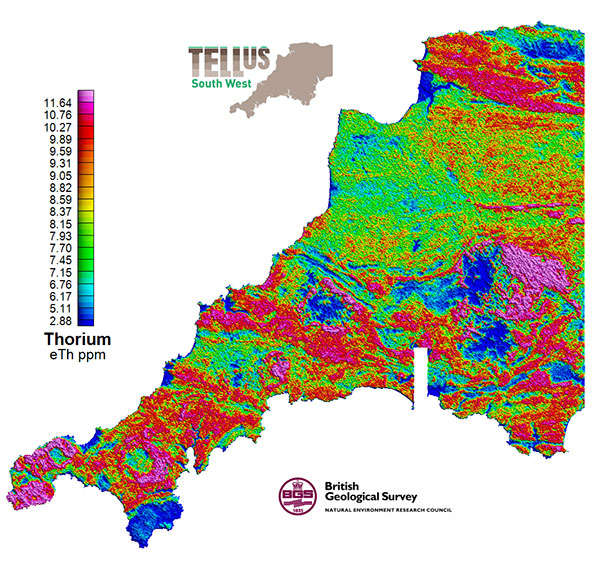
| Title | TellusSW airborne geophysics - Radiometric data: Observed Thorium ground concentrations |
|---|---|
| Source | British Geological Survey |
| Enquiries | enquiries@bgs.ac.uk |
| Scale(s) | 40m square grid |
| Coverage | South West England |
| Format | GEOTIFF (embedded georeference) image and CSV files |
| Price | The GEOTIFF is free for use under Open Government Licence terms |
| Uses | Local to regional level use |
| Map Viewer | View in UKSO Map Viewer |
| WMS link | https://map.bgs.ac.uk/... |
| Images | High resolution | low resolution |
The map shows the observed Total Count Radiometric data. The colour scheme is based on an equal-area scheme such that each colour occupies an equal area on the map. Shaded relief is from the NE.
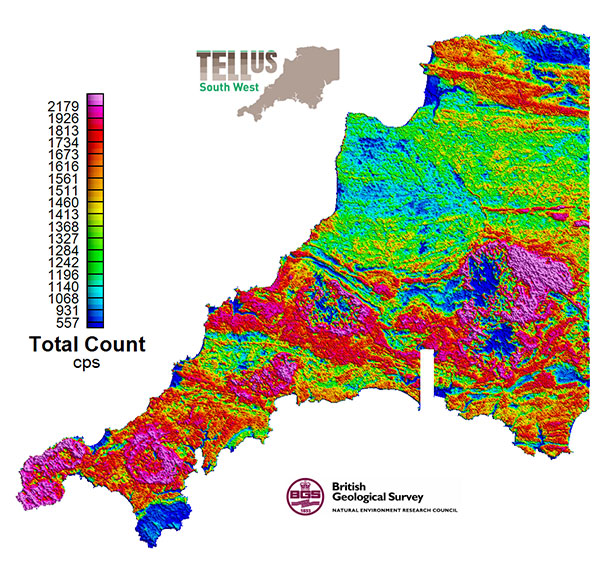
| Title | TellusSW airborne geophysics - Radiometric data: Total count in cps |
|---|---|
| Source | British Geological Survey |
| Enquiries | enquiries@bgs.ac.uk |
| Scale(s) | 40m square grid |
| Coverage | South West England |
| Format | GEOTIFF (embedded georeference) image and CSV files |
| Price | The GEOTIFF is free for use under Open Government Licence terms |
| Uses | Local to regional level use |
| Map Viewer | View in UKSO Map Viewer |
| WMS link | https://map.bgs.ac.uk/... |
| Images | High resolution | low resolution |
The map shows the derived Uranium to Potassium ratio. The colour scheme is based on an equal-area scheme such that each colour occupies an equal area on the map. Shaded relief is from the NE.
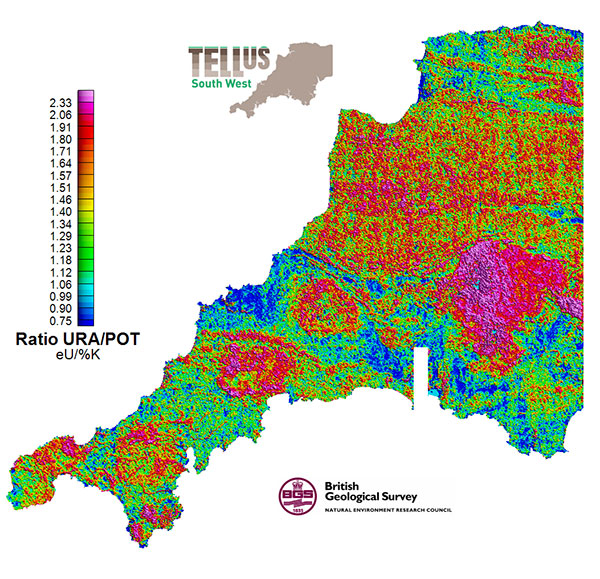
| Title | TellusSW airborne geophysics - Radiometric data: Derived Uranium to Potassium ratio |
|---|---|
| Source | British Geological Survey |
| Enquiries | enquiries@bgs.ac.uk |
| Scale(s) | 40m square grid |
| Coverage | South West England |
| Format | GEOTIFF (embedded georeference) image and CSV files |
| Price | The GEOTIFF is free for use under Open Government Licence terms |
| Uses | Local to regional level use |
| Map Viewer | View in UKSO Map Viewer |
| WMS link | https://map.bgs.ac.uk/... |
| Images | High resolution | low resolution |
The map shows the observed Uranium ground concentrations. The colour scheme is based on an equal-area scheme such that each colour occupies an equal area on the map. Shaded relief is from the NE.
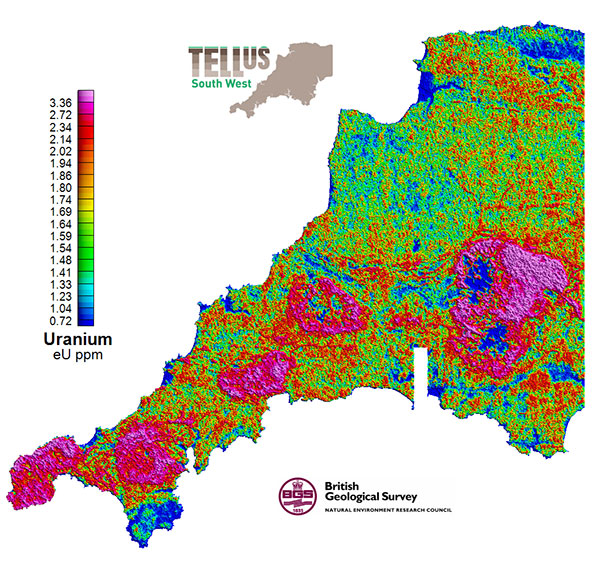
| Title | TellusSW airborne geophysics - Radiometric data: Observed Uranium ground concentrations |
|---|---|
| Source | British Geological Survey |
| Enquiries | enquiries@bgs.ac.uk |
| Scale(s) | 40m square grid |
| Coverage | South West England |
| Format | GEOTIFF (embedded georeference) image and CSV files |
| Price | The GEOTIFF is free for use under Open Government Licence terms |
| Uses | Local to regional level use |
| Map Viewer | View in UKSO Map Viewer |
| WMS link | https://map.bgs.ac.uk/... |
| Images | High resolution | low resolution |